Community genogram · Shared by a GenogramAI user
Tutorial: Getting Started Genogram
The Tutorial: Getting Started Genogram maps 16 people across three generations. It records 1 deceased member and health history including depression, PTSD and heart disease. Relationship lines show conflict, and the family structure includes cohabitation.
- 16 people
- 3 generations
- Depression, PTSD, heart disease
- Conflict, cohabitation
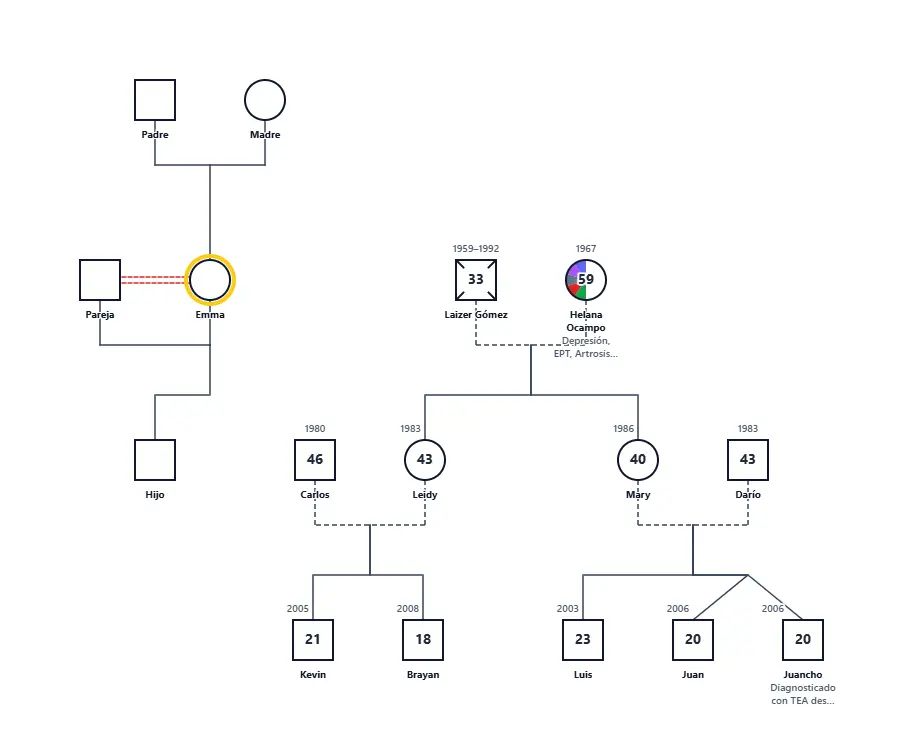
What this genogram shows
- 16 family members across three generations.
- 2 partnerships.
- 1 deceased person is marked with the deceased symbol.
- 1 person has recorded health conditions: depression, PTSD, heart disease and diabetes.
- Emotional relationship lines: conflict.
Compare with similar examples
Symbols used
- Marriage
- A horizontal line joining two partners.
- Deceased
- An X drawn through the person symbol.
- Medical condition
- Filled or shaded segments inside the symbol mark recorded health conditions.
- Conflict / hostility
- A red zigzag line for ongoing conflict or hostility.
See the full genogram symbols guide for every notation.
Generation by generation
Generation 1 (oldest)
There are 4 people on the top row (2 men and 2 women). The deceased symbol appears on 1 person here. Partner lines join 2 couples: 1 married and 1 unmarried. 3 children descend from 2 sets of parents here; the largest sibling group has 2, and one has a single child.
Generation 2
The second row has 6 people (3 men and 3 women). 3 partners marry in from outside the family. The row contains 3 partnerships: 1 married and 2 unmarried. Between them, 3 sets of parents have 6 children in the next row; the largest sibling group has 3, and one has a single child.
Generation 3 (youngest)
The bottom row holds 6 people, all male.
Emotional relationships
1 emotional relationship line connects 2 people: 1 conflicted relationship.
Health history
Health history is recorded for 1 person: depression (1 person), diabetes (1 person), heart disease (1 person) and PTSD (1 person). Each condition stays within a single generation here.
How to read this genogram
- Start at the top row: the 4 people of the oldest generation. Squares are males and circles are females; this chart has 11 squares and 5 circles.
- Follow the horizontal lines between partners. There are 5 partner lines.
- Trace the vertical lines that drop from each couple to their children. 9 people have parents drawn in this genogram.
- Look for an X through a symbol: it marks a person who has died. 1 person is marked that way here.
- Read the coloured or patterned lines last. They describe how people get along: dashed red parallel lines for conflicted relationships.
- Finish at the bottom row, the youngest generation, with 6 people.
Start from this genogram
Open it in GenogramAI, make a copy, and edit the people, relationships and health history to fit your own family or case. Or describe a family in plain words and let the AI draw it.
Questions about this genogram
How many people and generations are in the Tutorial: Getting Started Genogram?
It shows 16 people across three generations, from 4 people in the oldest row to 6 people in the youngest. It includes 5 couples. 1 person is marked deceased.
What do the lines in this genogram mean?
Solid horizontal lines join partners, and vertical lines connect parents to children. The other lines are emotional relationship lines: 1 conflicted relationship. The genogram symbols guide on genogramai.com shows every line style.
Can I use this genogram as a template?
Yes. Choose "Use this template" to copy it into a free GenogramAI account, then replace the people and relationships with your own.
How do I make a genogram like this one?
Open the GenogramAI genogram maker and describe the family in plain words, for example how many generations, who is married or divorced, and who the children are. The AI draws it with the same notation, and you can edit every person and line afterwards. For a three-generation chart like this, start with the oldest couple and work down one row at a time.
More community genograms
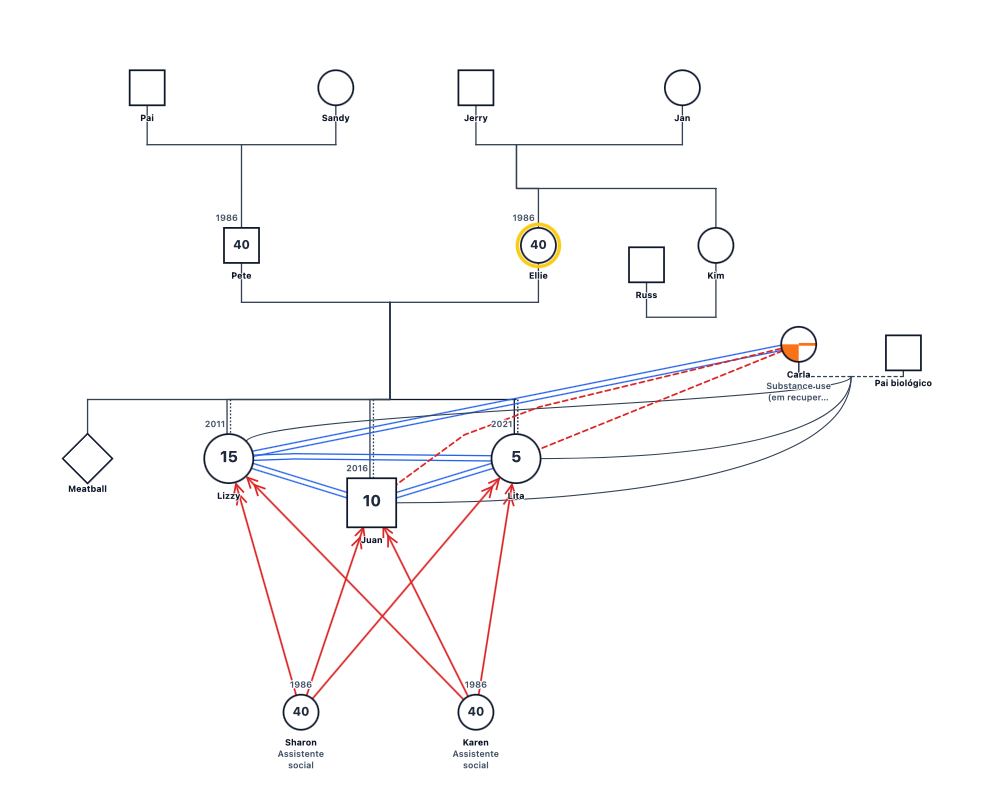
Instant Family Genogram
16 people · 3 generations · Adoption, Emotional lines
Amigos Intocables Genogram
14 people · 3 generations · Adoption, Emotional lines
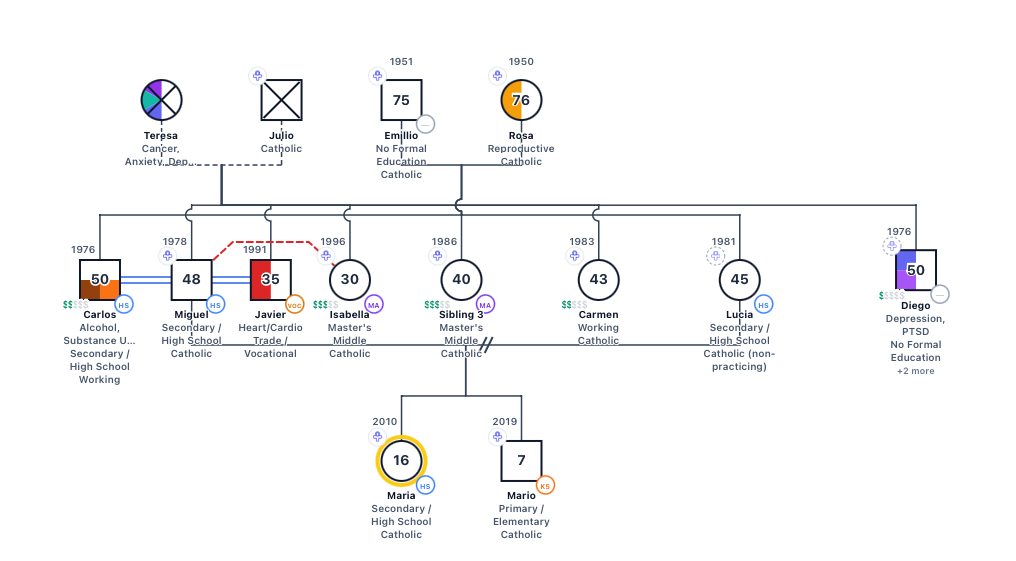
Maria's Family Genogram
14 people · 3 generations · Blended family, Divorce
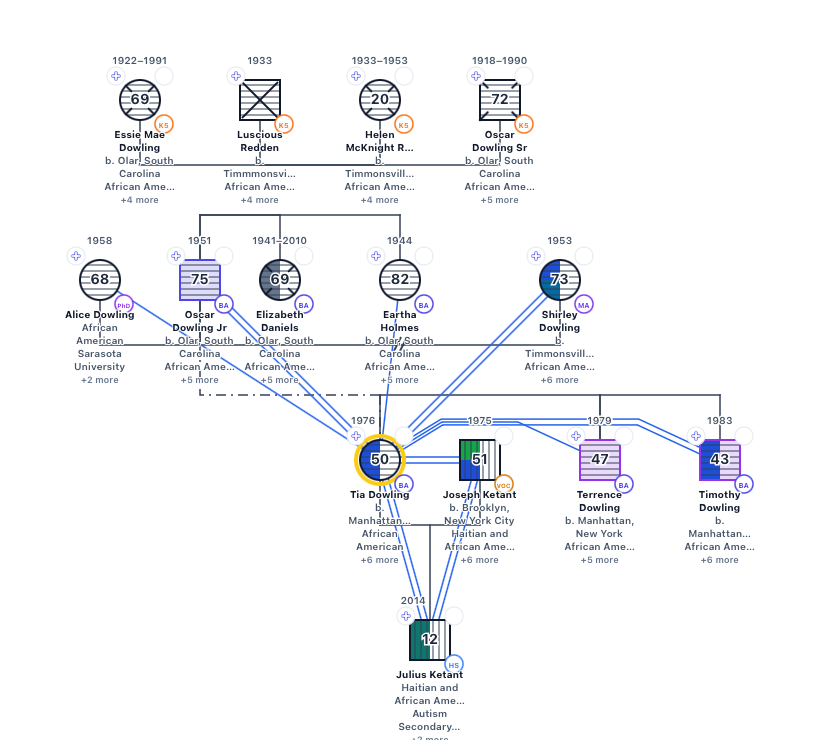
Tia Dowling's Family Genogram
14 people · 3 generations · Blended family, Divorce
Role Play Project Genogram
13 people · 3 generations · Blended family, 2 divorces/separations
Eliana's Family Genogram
12 people · 3 generations · Emotional lines, Medical history
About community genograms: a GenogramAI user published this genogram to the community gallery and chose to feature it on genogramai.com. It is shown as an illustration of genogram notation, not a clinical record. The owner can remove it at any time.