Complete guide
What is a genogram?
Quick answer
A genogram example, labelled
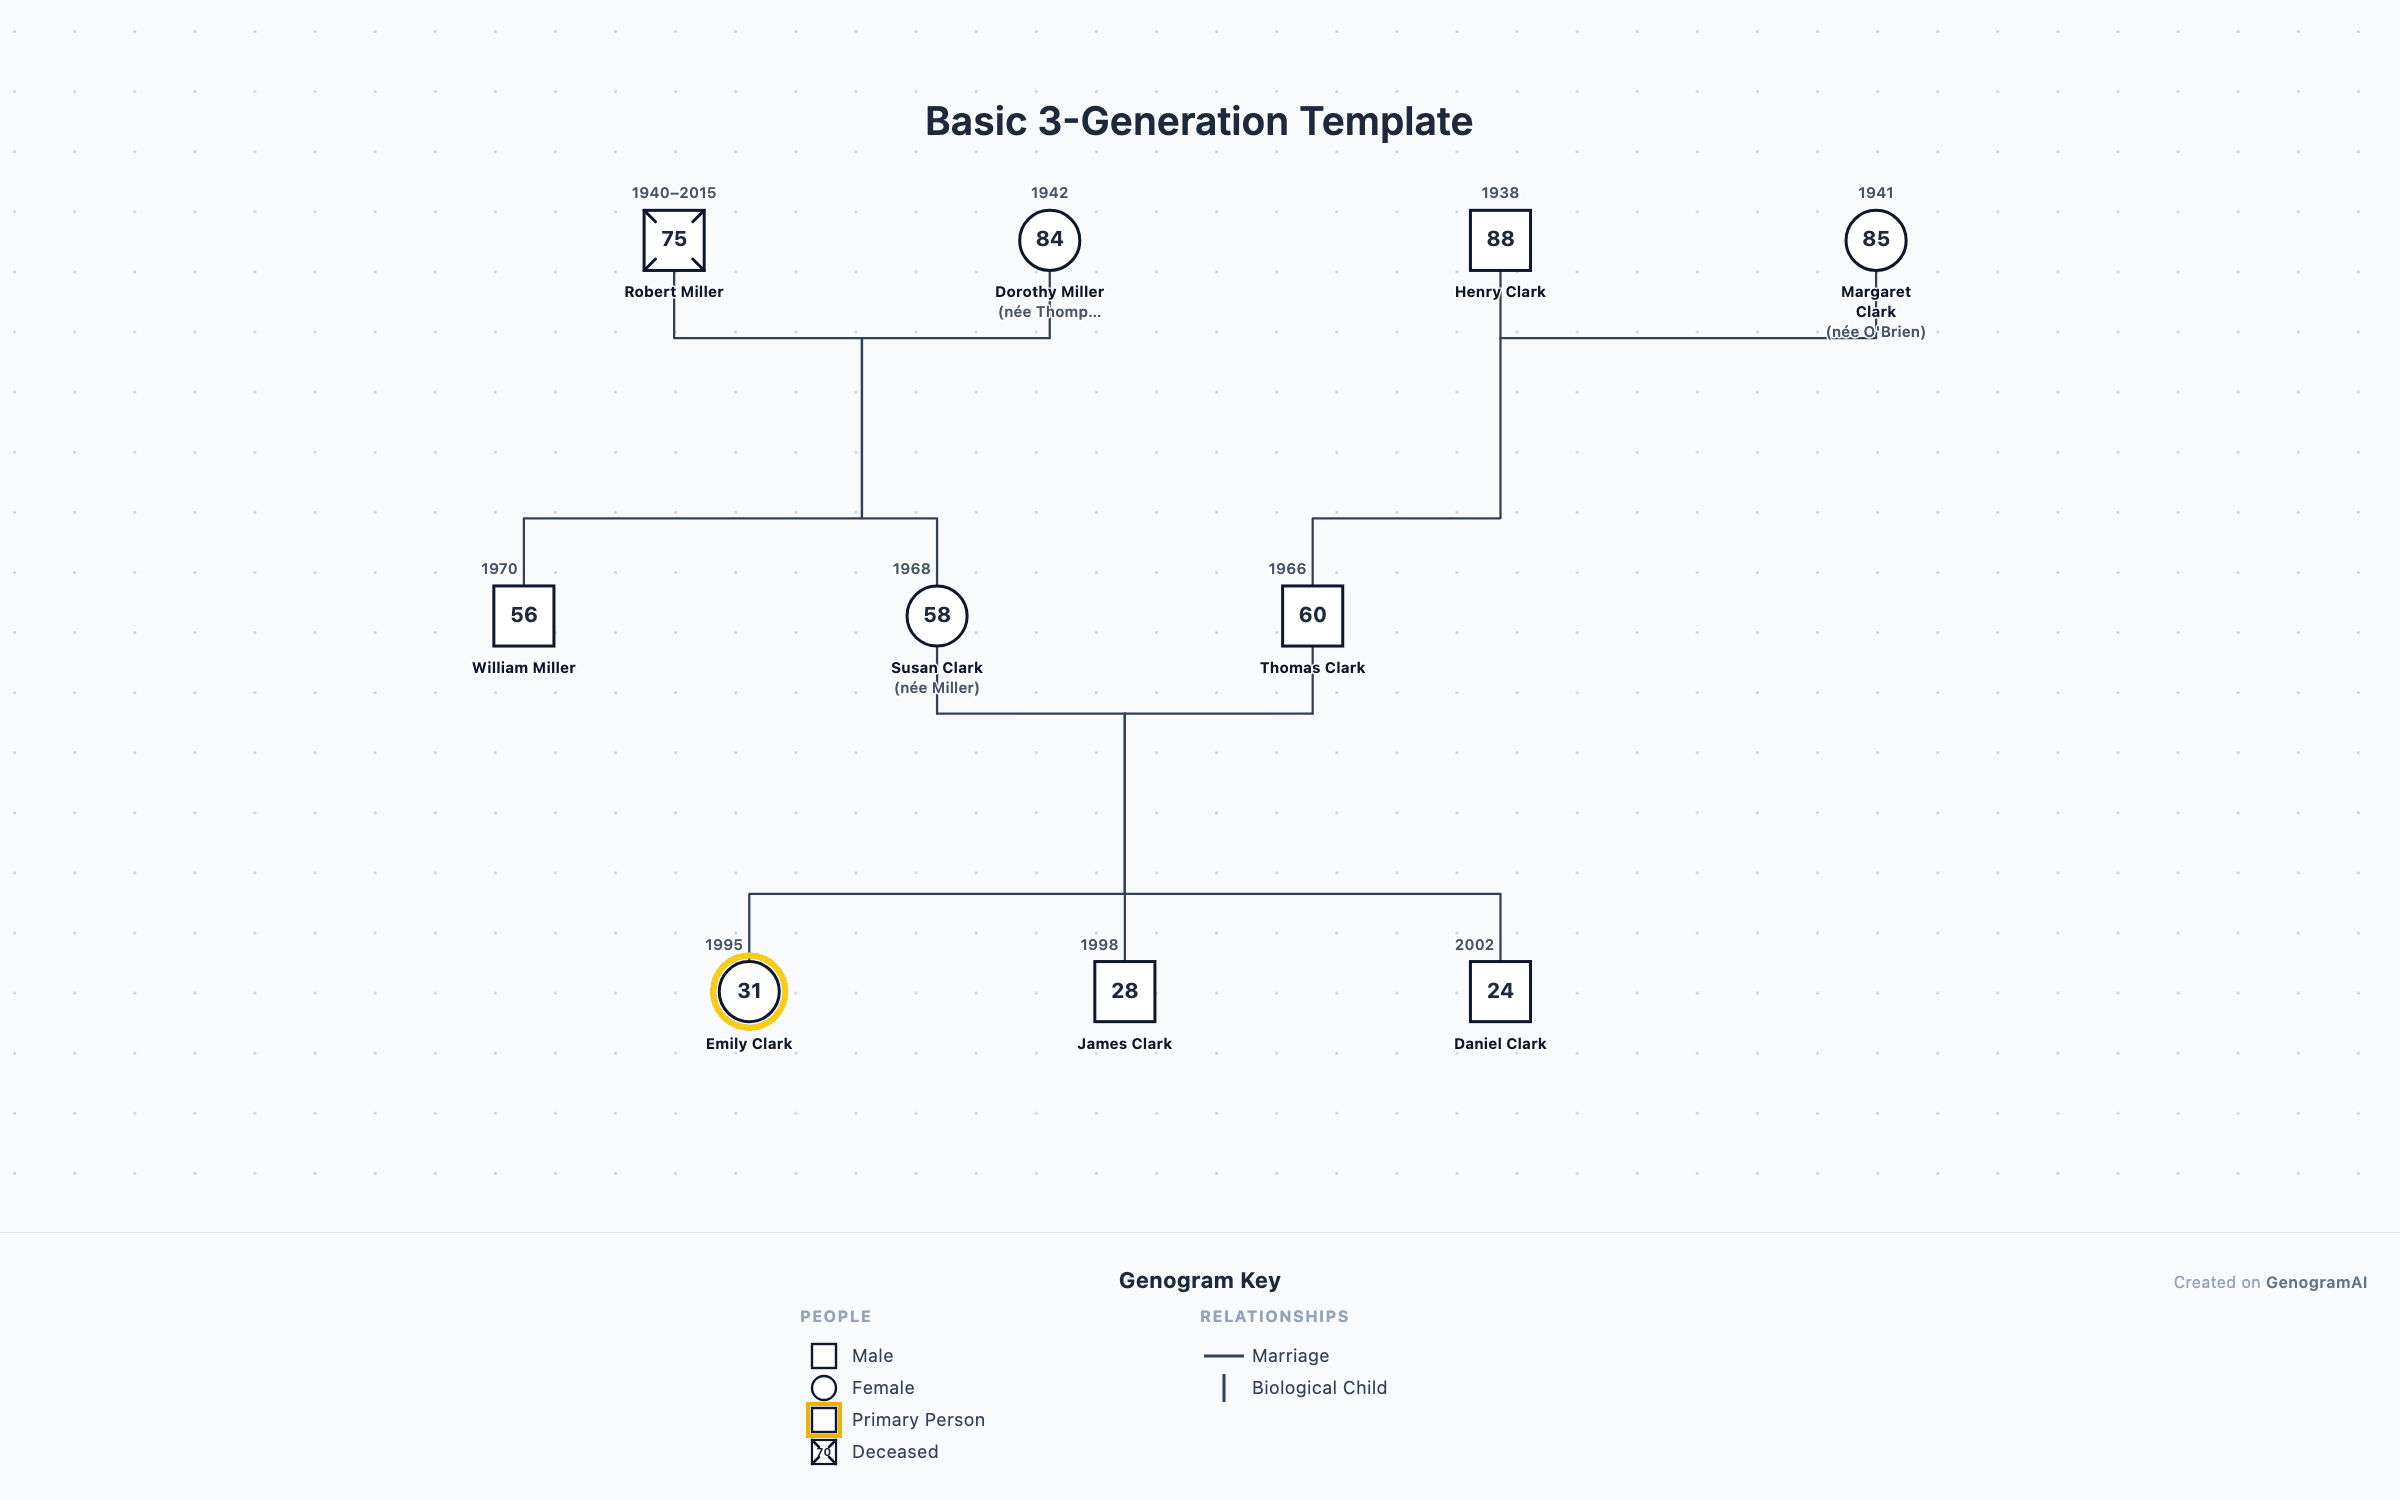
| What you see | What it means |
|---|---|
| Three rows of people | Three generations: grandparents on top, parents in the middle, the index person and siblings at the bottom |
| Squares and circles | Males (squares) and females (circles); the number inside is the current age, the year above is the birth year |
| Highlighted circle (Emily Clark) | The index person, also called the identified patient or primary person: the person the genogram is centred on |
| Square with an X (Robert Miller, 1940-2015) | A deceased family member, with birth and death years |
| Horizontal line between two people | A marriage; the partner line is where separation or divorce slashes would go |
| Vertical lines dropping from a partner line | Biological children, drawn oldest on the left to youngest on the right |
| "née Miller" under a name | Birth (maiden) name, which links a person to their family of origin |
| Key at the bottom | The legend, which explains every symbol and line used in the diagram |
Genogram definition
A genogram (pronounced JEN-o-gram) is a pictorial display of a person's family relationships and medical history. It goes beyond a traditional family tree by using standardized symbols to show not just who is related to whom, but also the nature and quality of those relationships.
Genograms grew out of Murray Bowen's family systems theory and the family diagrams Bowen and his colleagues used in the 1970s. In 1985, family therapists Monica McGoldrick and Randy Gerson standardized the symbols and format, and genograms have since become essential tools in family therapy, social work, nursing, genetic counseling and other clinical practice. They are widely taught in counseling, marriage and family therapy, social work and nursing programs. Today, a genogram maker like GenogramAI can use AI to build a genogram from a plain-text description, helping practitioners and families visualize patterns that might otherwise remain hidden.
Classic reference
Key takeaway
Genogram vs family tree: what's the difference?
| Family tree | Genogram | |
|---|---|---|
| Shows | Biological relationships: who descends from whom | Biological and legal ties plus emotional relationships |
| Typical content | Names, dates, and ancestry | Names and dates plus medical history, mental health, substance use, life events |
| Relationship detail | Simple lines connecting relatives | Line styles for marriage, separation, divorce, cohabitation, and for closeness, conflict, fusion and cutoff |
| Symbols | Informal; varies by tool | Standardized clinical symbols (squares, circles, slashes, X for deceased) |
| Generations | As many as can be traced | Usually three, centred on an index person |
| Used for | Genealogy research | Therapy, medicine, social work, nursing and education |
| Main question it answers | Where do I come from? | What patterns repeat in this family, and how do they affect the person now? |
For a full side-by-side, see genogram vs family tree.
What is a genogram used for?
In therapy and counseling
- Assessing the family as a system at intake
- Spotting repeating patterns across generations
- Mapping triangles, alliances and cutoffs
- Reframing a presenting problem in family context
- Planning and tracking treatment
In health, social work and education
- Recording hereditary conditions and causes of death
- Child welfare and kinship care assessments
- Family health assessments in nursing
- Genetic risk assessment
- Family-of-origin assignments in graduate programs
What can a genogram show?
Family structure
Emotional relationships
Medical history
Mental health
Cultural factors
Life events
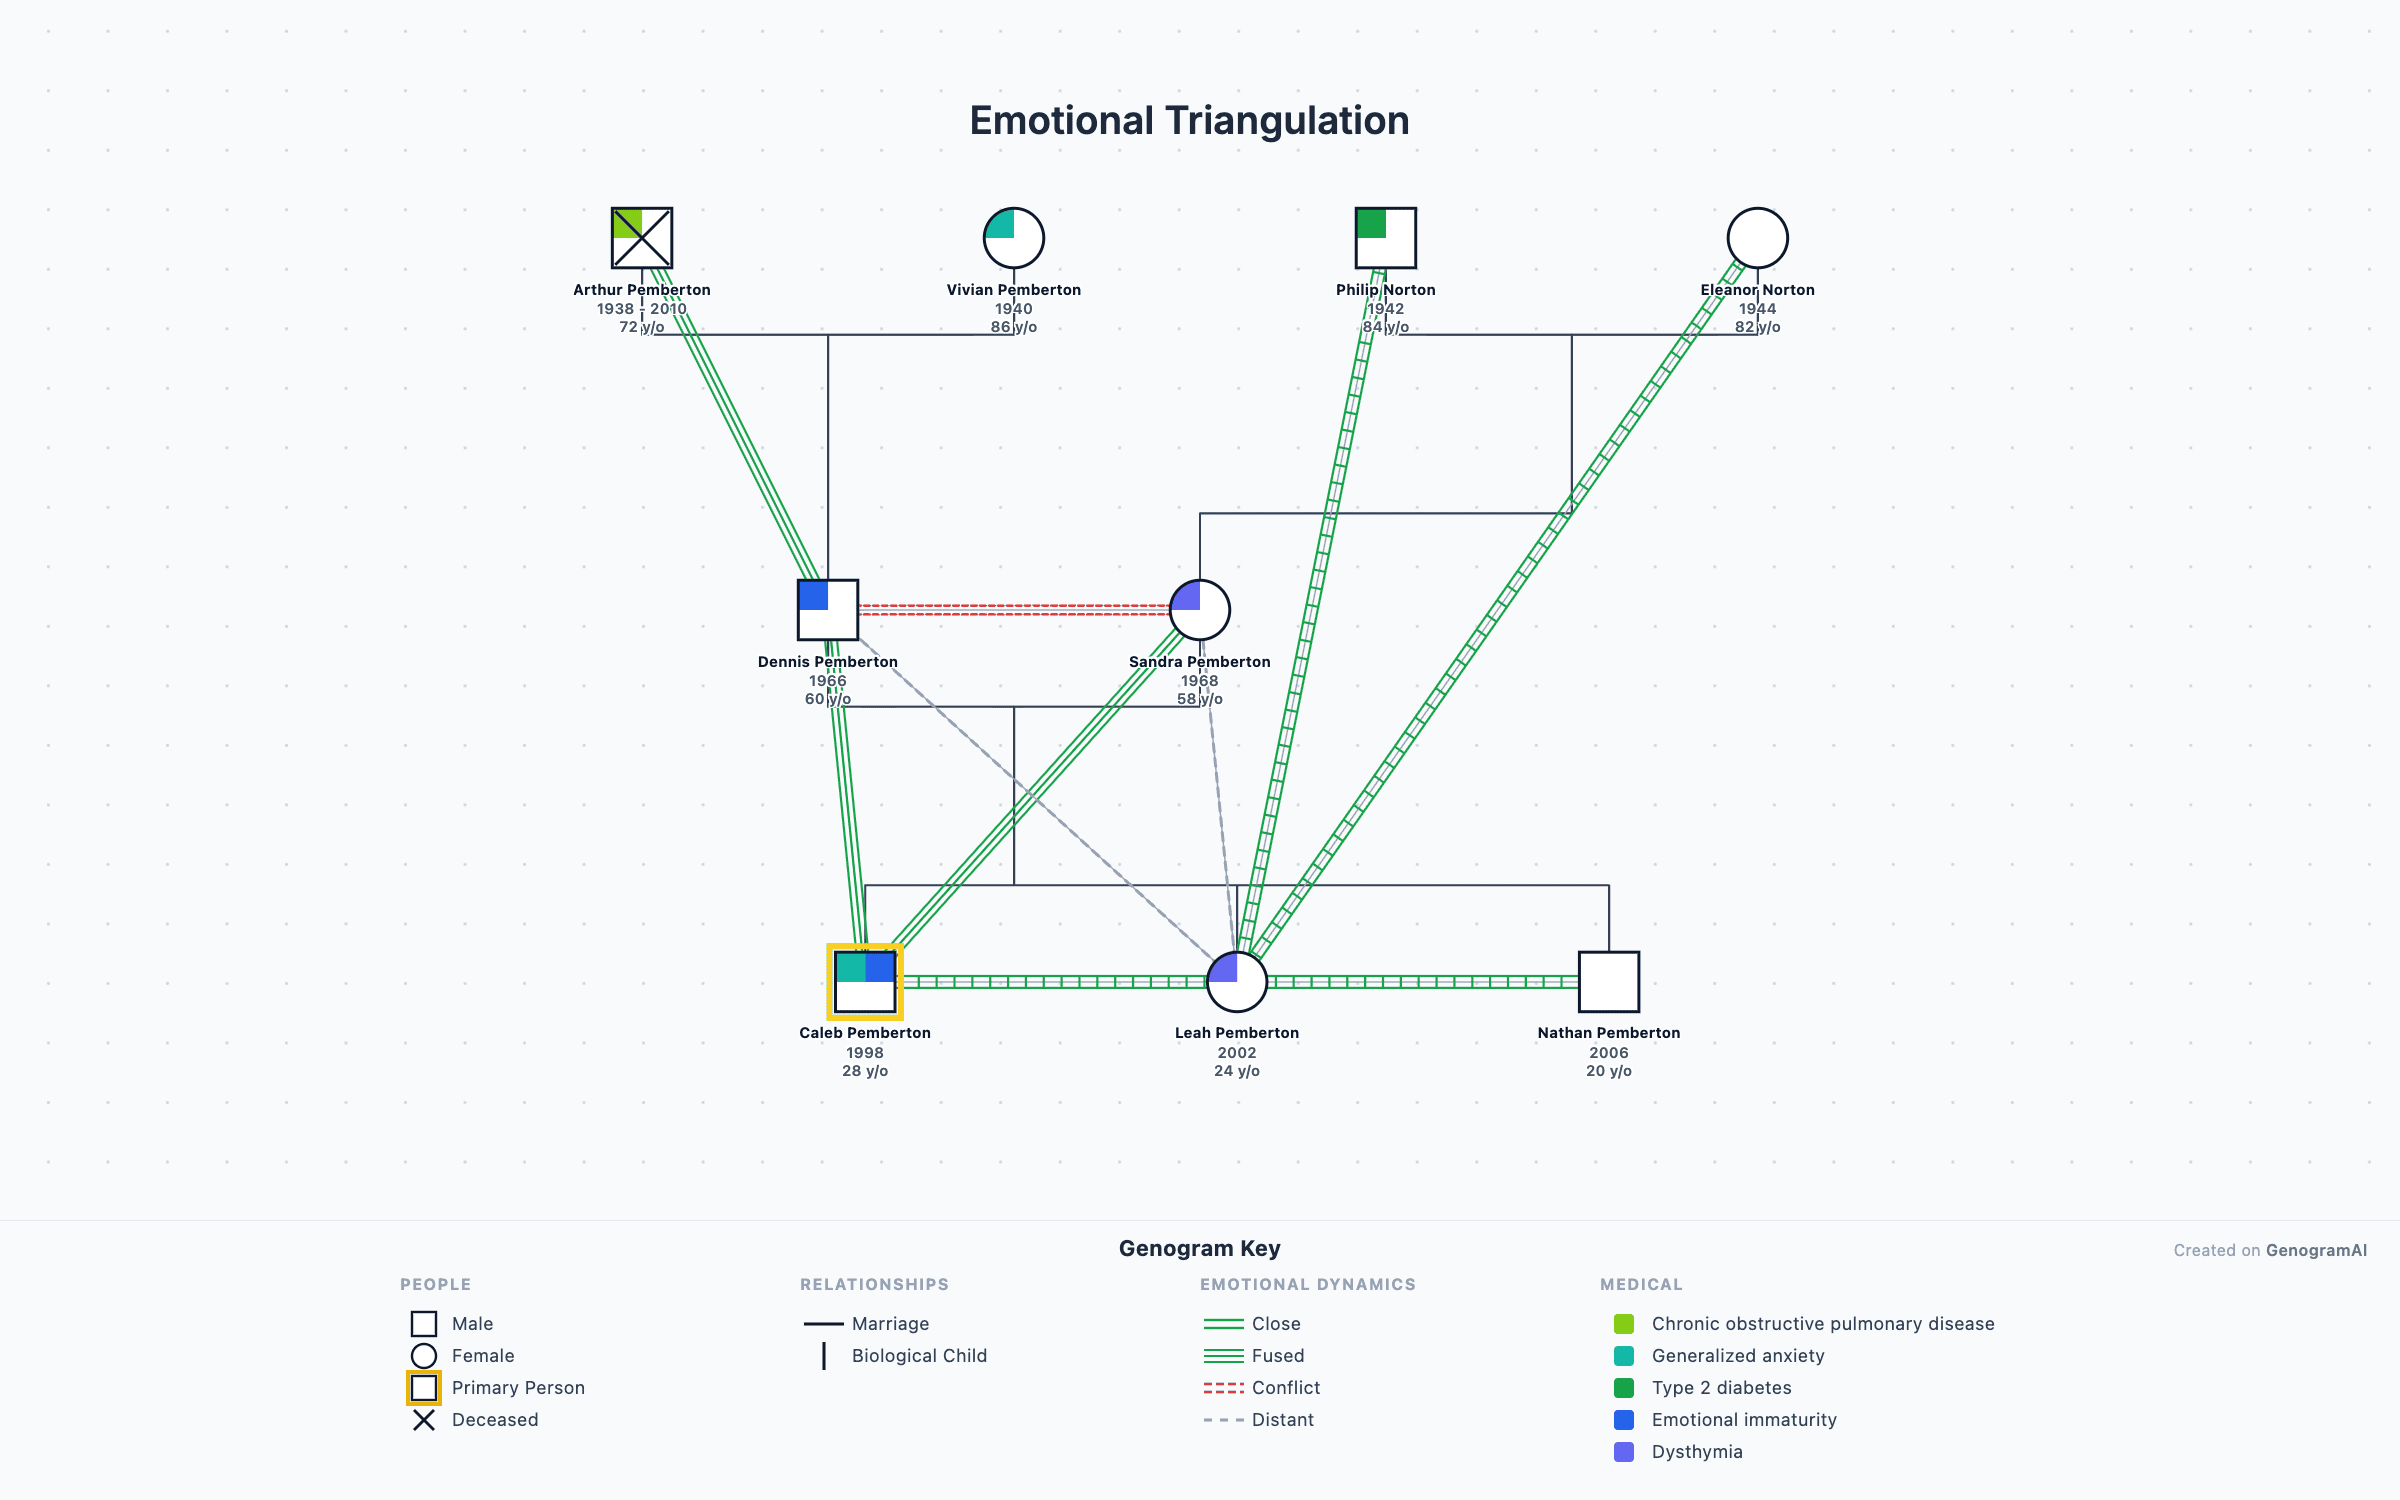
Basic genogram symbols
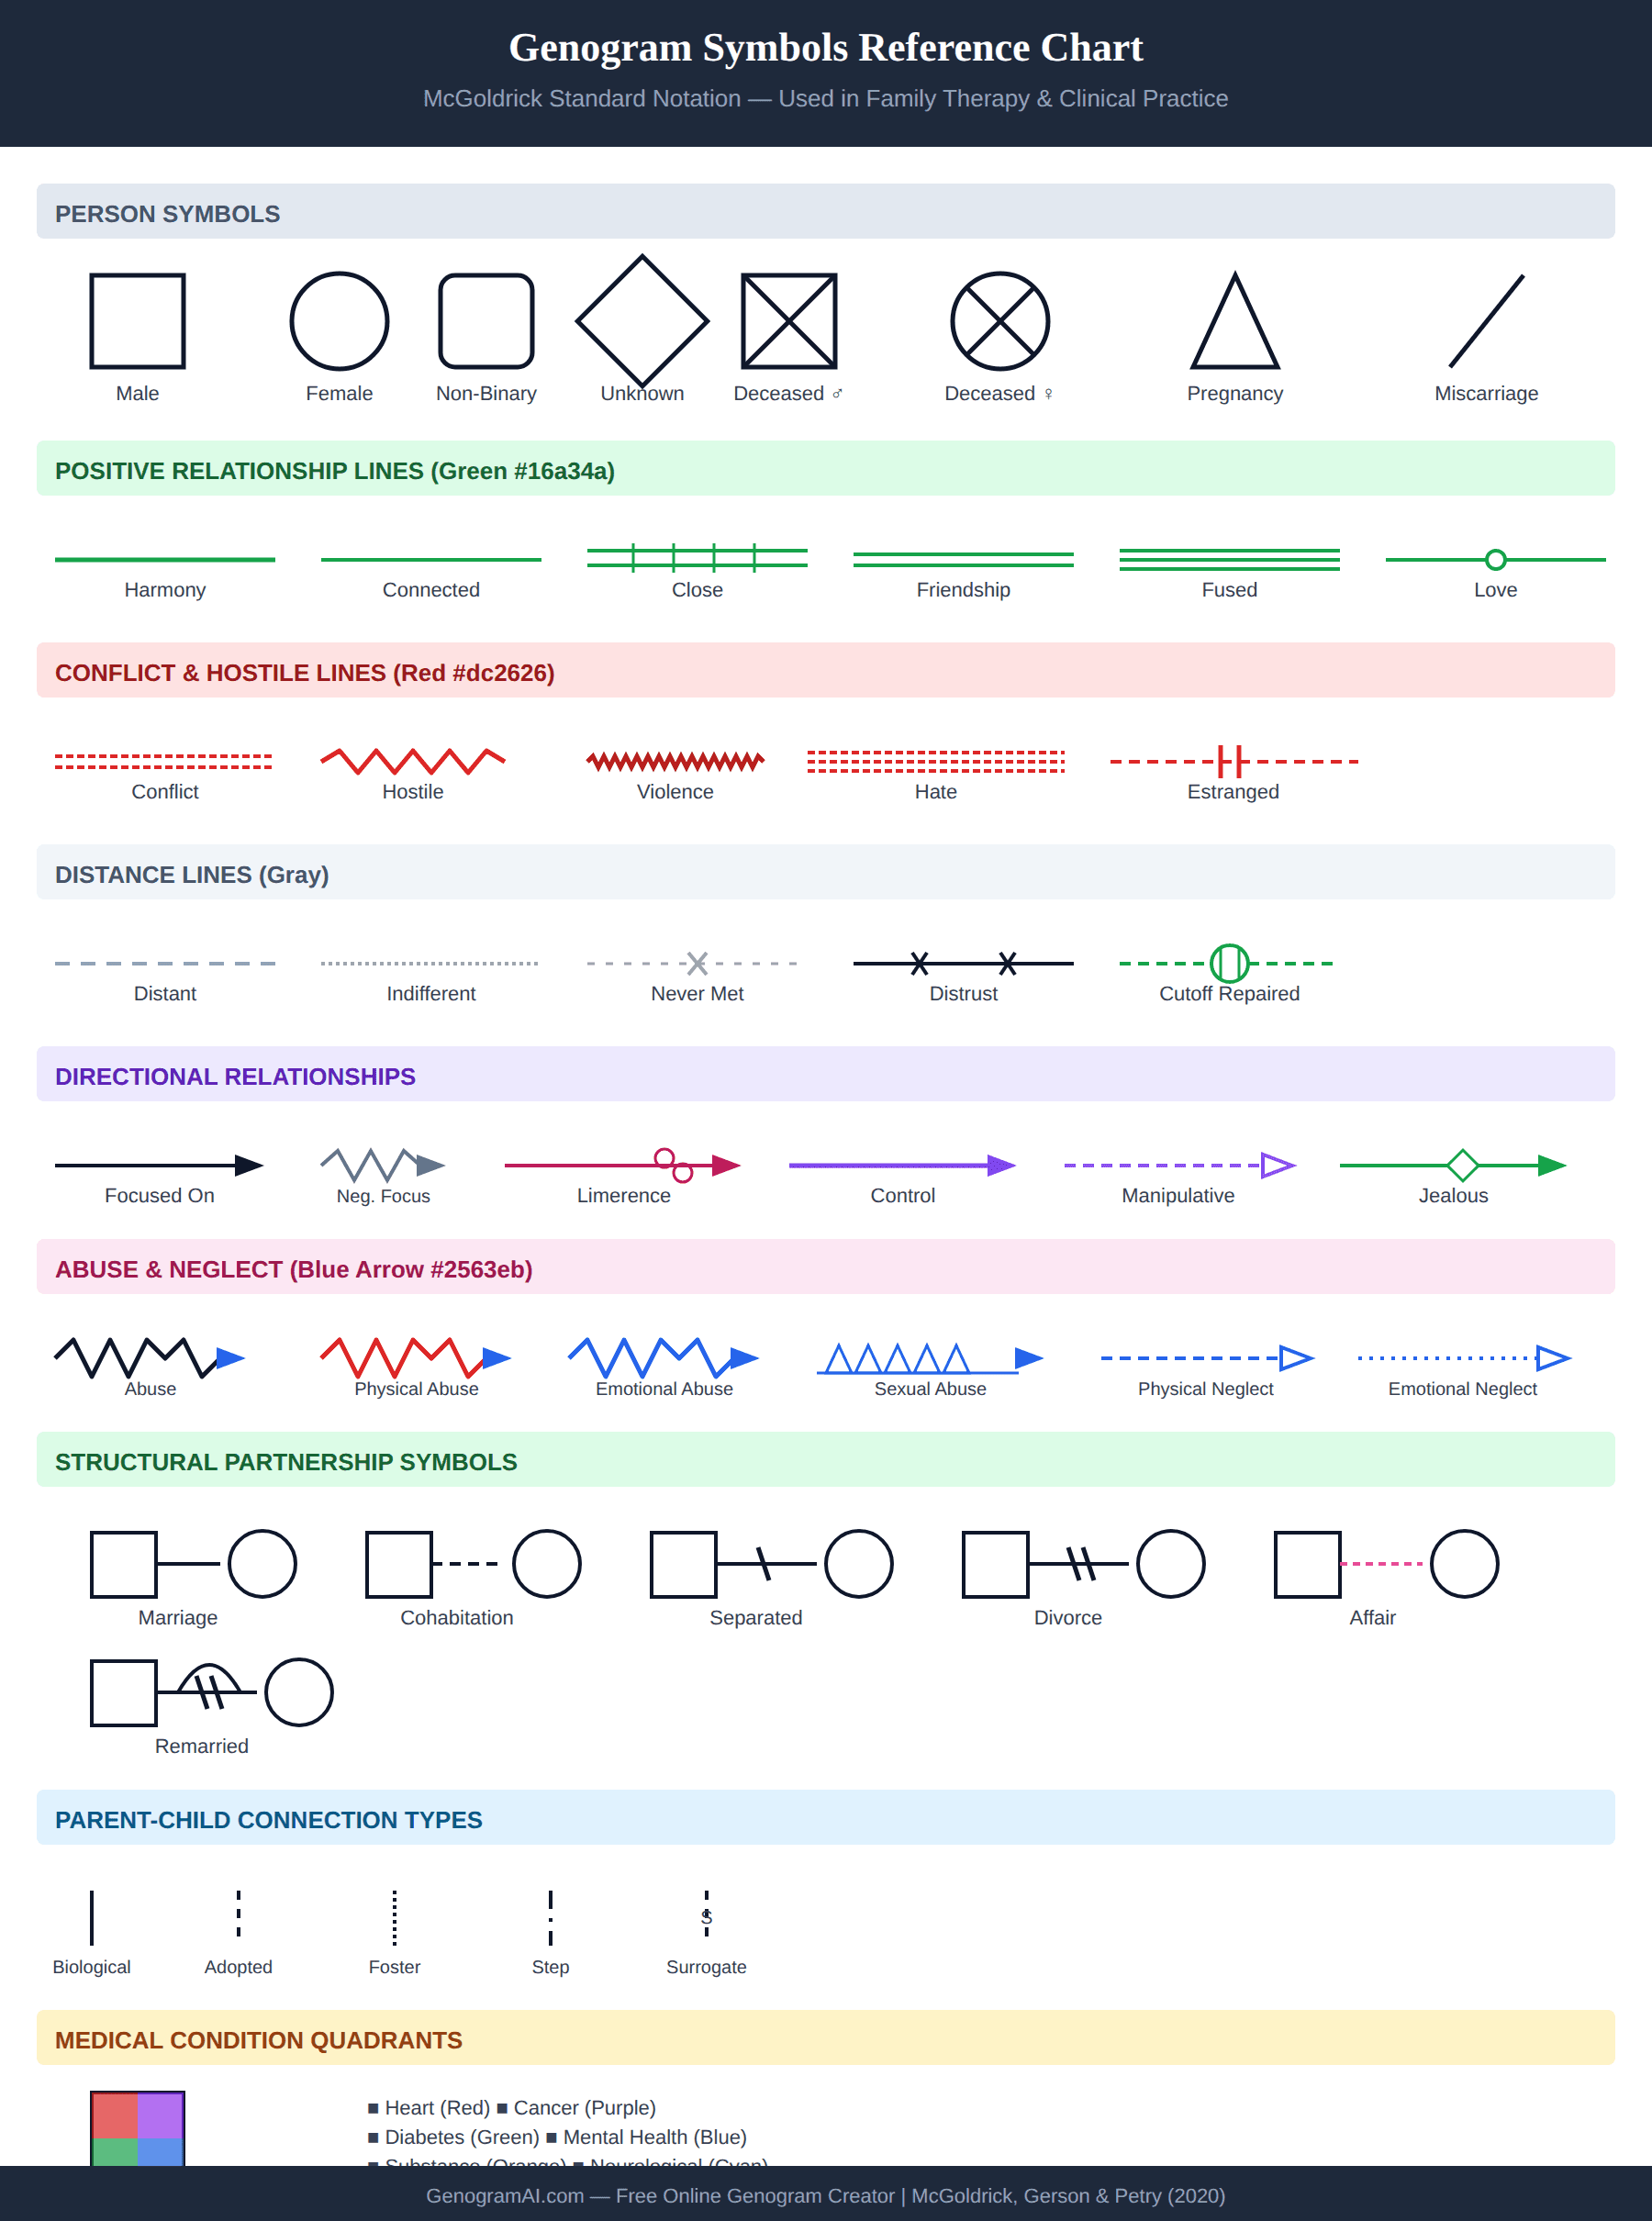
| Symbol | Name | How it is drawn |
|---|---|---|
| Male | Square | |
| Female | Circle | |
| Unknown or other gender | Diamond | |
| Deceased | X through the symbol, with birth and death years above | |
| Pregnancy | Triangle | |
| Miscarriage | Small filled circle | |
| Marriage | Solid line joining partners (male usually on the left) | |
| Separation | One slash across the partner line | |
| Divorce | Two slashes across the partner line | |
| Cohabitation | Dashed partner line | |
| Adoption | Dashed line from parents to the adopted child | |
| Twins | Two child lines from one point (a bar between them means identical) |
Where genograms come from
| When | What happened |
|---|---|
| 1950s | Murray Bowen develops family systems theory and begins using family diagrams in clinical work |
| 1970s | Bowen and colleagues use family diagrams for multigenerational assessment; the term "genogram" enters clinical use |
| 1978 | Bowen publishes Family Therapy in Clinical Practice |
| 1985 | Monica McGoldrick and Randy Gerson standardize the symbols and format in Genograms in Family Assessment |
| 1999 | Second edition, Genograms: Assessment and Intervention (with Sylvia Shellenberger), expands clinical applications |
| 2008 | Third edition by McGoldrick, Gerson and Petry |
| 2020 | Fourth edition, Genograms: Assessment and Treatment |
| 2020s | Digital and AI tools build genograms from text descriptions |
More detail in the history of genograms.
Who uses genograms?
Family therapists
Marriage counselors
Social workers
Physicians
Genetic counselors
Psychiatrists
Nurses
Researchers
Frequently asked questions about genograms
What is a genogram?
A genogram is a graphical representation of a family tree that displays detailed information about relationships, medical history, emotional patterns, and other family dynamics across multiple generations. Unlike simple family trees, genograms use standardized symbols to show the quality of relationships, health conditions, and behavioral patterns.
What is a genogram used for?
Genograms are used to assess a family as a system: to see repeating patterns (divorce, addiction, illness, caretaking roles), map emotional closeness, conflict and cutoffs, track hereditary medical conditions, and put a person's current problem in family context. Therapists use them for assessment and treatment planning, social workers for case documentation, and nurses and physicians for family health history.
What is the difference between a genogram and a family tree?
While both show family relationships, a genogram includes much more detail. Family trees show biological connections (who is related to whom), while genograms add relationship quality (close, distant, conflictual), medical history, emotional patterns, divorces, remarriages, and other clinical information using standardized symbols.
Who invented the genogram?
No single person. Genograms grew out of Murray Bowen's family systems theory and the family diagrams used by Bowen and his colleagues in the 1970s. Monica McGoldrick and Randy Gerson standardized the symbols and format in their 1985 book Genograms in Family Assessment, and later editions (1999, 2008, 2020) expanded the notation.
Who uses genograms?
Genograms are used by family therapists, marriage counselors, social workers, physicians (especially genetic counselors), psychiatrists, nurses, and researchers. They're also valuable for individuals exploring their family history or understanding multigenerational patterns.
What is a genogram in social work?
In social work, a genogram is an assessment and documentation tool that maps a client's family structure, relationships and stressors across generations. Social workers use it at intake, in child welfare and kinship care assessments, and in case planning, often together with an eco-map that shows the family's connections to outside systems such as school, work and services.
What is a genogram in nursing?
In nursing, a genogram is a family health assessment diagram. Nurses use it to record hereditary conditions, causes of death, and family support across three generations, which helps identify health risks and plan care. Nursing programs often assign a genogram together with an eco-map as part of a family assessment.
What are genogram symbols?
Genogram symbols are standardized shapes and lines: squares for males, circles for females, diamonds for unknown gender. Relationship lines show marriages (solid), divorces (double slash), and emotional bonds (various patterns for close, distant, conflictual relationships). Additional symbols indicate deceased individuals, medical conditions, and life events.
How many generations should a genogram include?
A typical genogram includes three generations (see our 3 generation genogram guide for details). It covers the identified person (index person), their parents, and their grandparents. However, genograms can include more generations if relevant patterns extend further back, or fewer if information is limited.
What are the 5 components of a genogram?
The five core components of a genogram are: (1) Person symbols: squares for males, circles for females, diamonds for unknown gender; (2) Structural relationships: horizontal lines showing marriages, separations, and divorces; (3) Parent-child connections: vertical lines linking parents to children, including adopted and foster links; (4) Emotional relationship overlays: patterned lines showing closeness, conflict, cutoff, enmeshment, and other dynamics; and (5) Contextual annotations: medical conditions, mental health history, substance use, cultural heritage, and significant life events.
How do you make a genogram step by step?
To make a genogram: (1) Gather family information for at least three generations, (2) Draw the index person in the center using the correct gender symbol, (3) Add family members with squares, circles, or diamonds, (4) Connect them with structural relationship lines (marriage, divorce, children), (5) Layer in emotional relationship overlays (close, distant, conflictual), (6) Annotate medical history, mental health, and life events, and (7) Review for accuracy. You can use an AI-powered genogram maker like GenogramAI to create one in minutes.
Is there a free genogram maker?
Yes. GenogramAI's free plan includes 2 genograms, 5 AI credits a month, all 64 relationship types with standard symbols, emotional relationship overlays, medical quadrants and PNG export. It runs in your browser with no download and no card. PDF, SVG and GEDCOM export are on paid plans.
Further Reading
- McGoldrick, M., Gerson, R., & Petry, S. — Genograms: Assessment and Treatment (4th ed.). W.W. Norton & Company, 2020.
- McGoldrick, M., & Gerson, R. — Genograms in Family Assessment. W.W. Norton & Company, 1985.
- Bowen, M. — Family Therapy in Clinical Practice. Jason Aronson, 1978.
- McGoldrick, M., Gerson, R., & Shellenberger, S. — Genograms: Assessment and Intervention (2nd ed.). W.W. Norton & Company, 1999.
- Like, R.C., Rogers, J., & McGoldrick, M. — Reading and Interpreting Genograms: A Systematic Approach. Journal of Family Practice, 26(4), 407-412, 1988.
Free printable genogram guides
What is a genogram (10-page guide)
The complete genogram reference (22 pages)
Ready to create your own genogram?
Use GenogramAI's free plan to create a professional genogram in minutes.
What is a genogram in social work and nursing?
In social work
Social workers use genograms as an assessment and documentation tool: at intake, in child welfare and kinship care assessments, and in case planning. A genogram shows family structure, relationships and stressors across generations, and is often paired with an eco-map that shows the family's ties to school, work, health care and community services. See genograms in social work.
In nursing
In nursing, a genogram is part of family health assessment. It records hereditary conditions, causes of death and family support across three generations, which helps identify health risks and plan care. Many nursing programs assign a genogram and eco-map together; see genograms and eco-maps in nursing and the guide for nursing students.