Summary
- The step-by-step guide covers the layout conventions and the hard cases: multiple marriages, half- and step-siblings, adoption, twins, large families and emotional lines.
- For the research, we built a test set of 199 genograms with 6,875 people: generated families from 1 to about 1,000 people, plus the 158 historical and illustrative genograms in our public example gallery.
- Every chart was laid out automatically and scored against the same readability measures. A full test pass is more than 2,700 automatic layouts, and we reran it for each of eight revisions.
- Against the original engine, the new Auto-Arrange draws 64% fewer line crossings, 86% fewer child lines that detour sideways and 92% fewer couples apart, on charts that are 17% narrower (median).
- Two measures got worse: family lines that leave the couple’s line off-centre, and siblings out of birth order. Both are explained below, with what we are doing about them.
Why genograms are hard to lay out
A family tree only has to show who descends from whom. A genogram has to show far more on one page: every partnership, in order, with marriages, divorces and separations drawn differently; children grouped under the right couple; half- and step-siblings; adoptive and foster children; twins; people who died; and often four or five generations. One person with three marriages has children from each, and those children marry into other families on the same chart.
Clinicians also read genograms by convention. In standard McGoldrick-style genogram notation, each generation sits on its own row, partners sit side by side, siblings run oldest to youngest from left to right, and each child hangs from the line of the couple who are its parents. A chart that breaks these conventions is harder to read even when every line is technically correct. Drawing a large family by hand that keeps all of them takes a long time, which is why Auto-Arrange exists.
How to arrange a complex genogram, step by step
Whether you draw by hand or in software, the same layout habits make a complex genogram readable. These are the placement conventions most clinical and training programmes expect, plus the practical choices that come up when a family does not fit the textbook. Work in this order: structure first, then details, then emotional relationships.
1. Start from the index person and work outward by generation
Put the index person (drawn with a double outline) near the middle of the page. Add their parents on the row above, their siblings beside them in birth order, and their children on the row below. Then add grandparents, aunts and uncles, and cousins, one generation at a time. Every generation gets its own row, and everyone in that generation sits on it, including people who married in. Leave more space between people than you think you need: most layout trouble starts when a late addition has nowhere to go.
2. Place couples, siblings and children by convention
- Couples: in a male–female couple the man is usually drawn on the left and the woman on the right, joined by a horizontal line below their symbols. Same-sex couples have no fixed side. Pick a rule, such as the older partner on the left, and use it throughout the chart.
- Siblings: oldest on the left to youngest on the right, by date of birth. Siblings who died, and pregnancies that ended in miscarriage or stillbirth, keep their place in that order.
- Children: one line drops from the middle of the parents’ partnership line to a horizontal sibling line, and each child hangs from that. The children should sit roughly centred under their parents, not off to one side.
The genogram rules page and the genogram symbols guide cover the symbols themselves.
3. Multiple marriages and partners
A genogram with multiple marriages stays readable when the partnerships appear in time order, earliest to most recent, so a reader can follow the sequence. When both people in the current couple were partnered before, a common arrangement puts each former partner on the outer side of the person they were with, so the current couple stays together in the middle. Mark a divorce with two slashes across the partnership line and a separation with one, and write the years on the line. Most important: the children of each union hang from that union’s own line, never from one parent alone. Henry VIII’s six marriages, shown below, are a good test of this.
4. Half-siblings, step-siblings and blended families
Half-siblings share one parent, so they hang from two different partnership lines of that parent. Put each set of children under its own couple, and keep the sets side by side in the order of the partnerships. Step-siblings have no shared parent; they are connected only through their parents’ new partnership, so do not draw a child line from a step-parent unless your key has a separate step-child line (GenogramAI draws it dash-dot). In a blended family genogram, many clinicians also circle the people who live together with a dotted line, so the household is clear without moving anyone out of their family. See the blended family genogram example.
5. Adoption, foster care and birth parents
Adopted and foster children take their place in the sibling row in birth order, like any other child; only their line to the parents changes. In GenogramAI an adopted child’s line is a paired solid-and-dotted line and a foster child’s line is dotted (see the adoption symbol). If birth parents are known and matter to the question you are asking, draw them to the side with their own line to the child, so the adoptive family keeps the main layout.
6. Twins, pregnancies and deceased family members
Twins hang from a single point on the sibling line, with a short bar between identical twins. A current pregnancy goes in the sibling row at the position its due date gives it, and miscarriages and stillbirths are placed the same way. People who have died keep their place and get an X through their symbol (the deceased symbol), with the year and age at death beside it.
7. Very large families
Three generations around the index person is the usual clinical scope; go further only when the question needs it. When a family is still too big for one page, summarise branches that do not bear on the question in a short note instead of drawing every person, or split the genogram across sheets, for example one for each side of the family, repeating the person who links them on both. Increase the spacing rather than squeezing names: a wide chart is easier to read than a crowded one.
8. Add emotional relationship lines last
Settle the structure before you draw any emotional relationship lines. A conflict or cutoff line between two people on opposite sides of the chart will cross everything in between, and every move you make afterwards drags it along. Draw only the relationships that matter for the question you are asking, and include a key.
What a readable genogram looks like
We turned those conventions into measurable criteria, each counted on the chart as drawn:
- No line crossings. A child’s line should not cut across another family’s line.
- Children under their parents. A child’s line should drop straight from the parents’ line, not detour sideways to reach it.
- Centred family lines. The line down to the children should leave the couple’s line near its middle, so it reads as both parents’ line.
- Partners side by side, on the same row, with nobody standing between them.
- One row per generation.
- Siblings in birth order, oldest on the left.
- Nothing overlapping: no symbols on top of each other and no names running into each other.
- Compact: no wider than it needs to be, so the chart fits a page or screen.
- Fast enough to feel instant on an ordinary chart.
How we measure Auto-Arrange: methodology
We evaluated layout quality the same way for every change: build a large set of test genograms, lay each one out automatically, score every chart, look at the drawings, and only keep a change that passes the whole set.
- Build the test set. The 199 test genograms come from three sources. 13 generated stress families, from a single person to 998 people, cover up to eight generations, people who have died, remarriages, cousin marriages, twins, adoption, pets, separate family trees on one canvas, a family with 25 children, deliberately broken data and people scattered at random as if dragged by hand. 28 generated multi-family charts, from 15 to 1,008 people, join several families by marriage, with in-laws on both sides, unrelated families on one canvas, half-siblings, single parents, twins and triplets, and very large sibling groups. Every generated family uses invented names and a fixed random seed, so the same charts come out on every run. The remaining 158 are the genograms in our public example gallery: historical and public families such as Henry VIII and his six wives, the Hemingways, the Darwin–Wedgwood family, the Romanovs and the Bach family, plus illustrative scenarios created by our team, such as blended, adoptive, foster and multi-divorce families.
- Lay out every chart automatically with both the original and the new Auto-Arrange, from the same starting positions, at default settings.
- Score every chart against the criteria above, using the lines exactly as the app draws them, so a crossing in the score is a crossing you would see.
- Run hard checks. A change fails the pass if it crashes on any chart, puts people on top of each other, splits a couple onto different rows where the original did not, or loses a relationship line. Further passes lay out each chart under every Auto-Arrange option and spacing, and arrange it twice to confirm a second arrange leaves it where it is. Together that is more than 2,700 automatic layouts per full pass.
- Review the drawings by eye. Numbers miss things, so we rendered samples from each dataset side by side and read them the way a clinician would. Several of the scores we use were added after a visual review caught a problem the existing ones missed.
- Repeat. The new Auto-Arrange went through eight revisions. Each one was scored on the full set, and kept only if it passed the hard checks and improved the scores overall.
Timings were measured on an Apple-silicon desktop, one layout at a time. The figures in this article are drawn from the same layouts with the app’s own line drawing.
Results: original vs new Auto-Arrange
Totals across all 199 charts (6,875 people), original Auto-Arrange against the new one:
| Measure | Original | New | Change |
|---|---|---|---|
| Line crossings | 3,094 | 1,127 | 64% fewer |
| Charts with any line crossing | 49 | 30 | 19 fewer charts |
| Child lines that detour sideways to reach their parents | 713 | 103 | 86% fewer |
| Partners not side by side | 75 | 6 | 92% fewer |
| People off their generation’s row | 9 | 7 | 2 fewer |
| Overlapping people | 1 | 1 | No change |
| Overlapping name labels | 0 | 0 | No change |
| Family lines that leave the couple’s line off-centre | 72 | 194 | 2.7 times as many |
| Siblings out of birth order | 140 | 169 | 21% more |
| Chart width, median chart | 400 px | 320 px | 17% narrower per chart (median) |
| Arrange time, median chart | 1.1 ms | 4.3 ms | Slower |
| Arrange time, slowest chart (about 1,000 people) | 38 ms | 481 ms | Slower |
Counts are totals over all charts. Chart width shrank on 177 of 199 charts and grew on 10; the median of each chart’s own change is 17% narrower. The one overlap, in both engines, is in a deliberately corrupted test file that gives two people the same identity.
Line crossings by dataset
Total crossings in each group of charts
Generated stress families
13 charts
Generated multi-family charts
28 charts
Example gallery genograms
158 charts
Charts with at least one problem
Out of 199 charts
Line crossings
Sideways child-line detours
Partners not side by side
Off-centre family lines
Siblings out of birth order
Most of the crossings that remain are in the largest charts: 985 of the 1,127 are in the 8 charts with 150 people or more, where several families intermarry over many generations. Among the 186 charts of 60 people or fewer, the number with any crossing fell from 37 to 19.
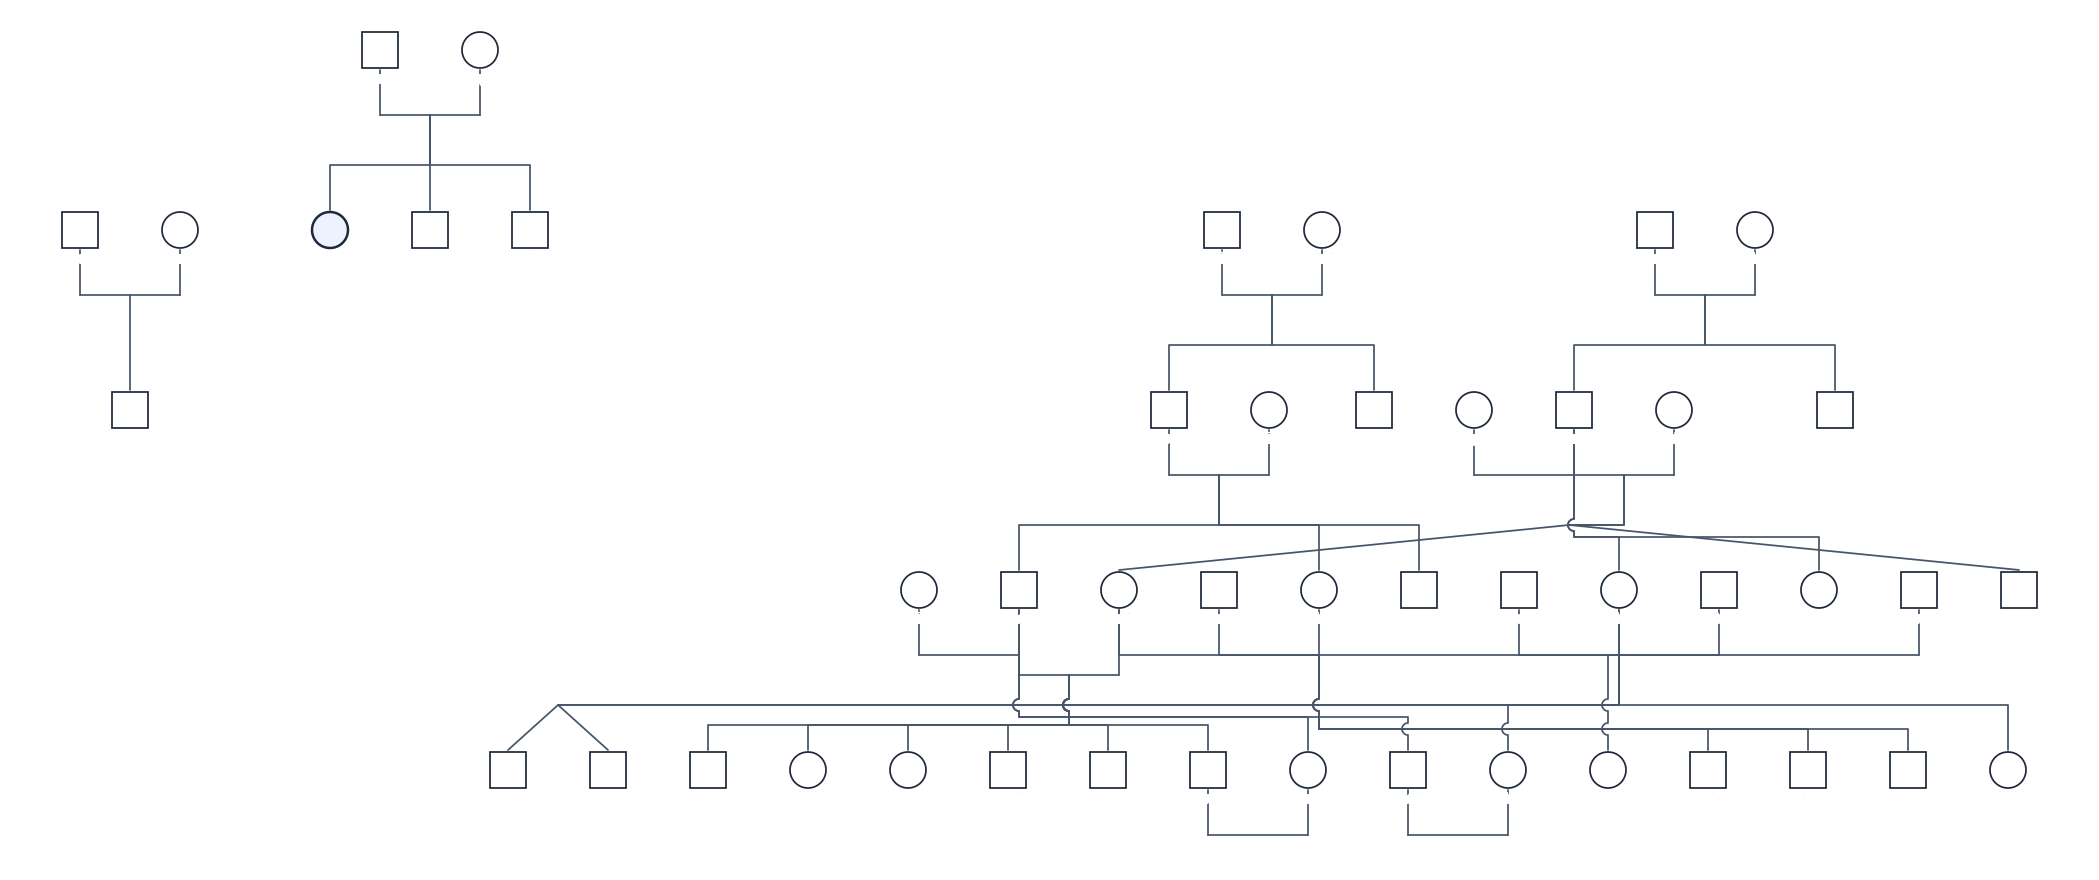
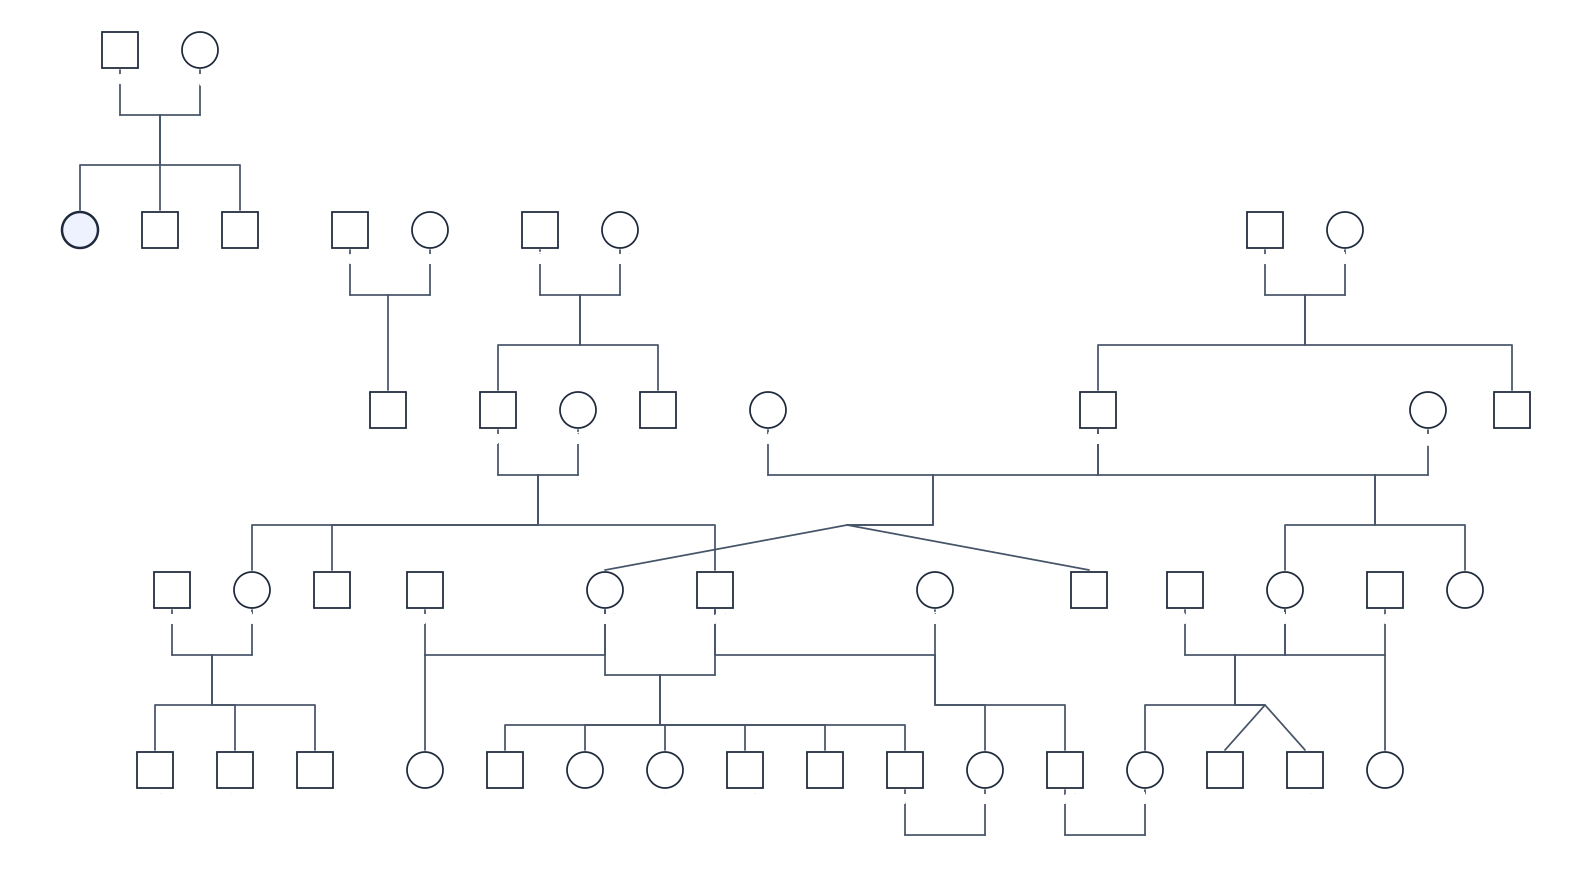
Before and after: three genograms
Three charts from the test set, drawn from the same data by each engine. Names are shortened to first names.
Original
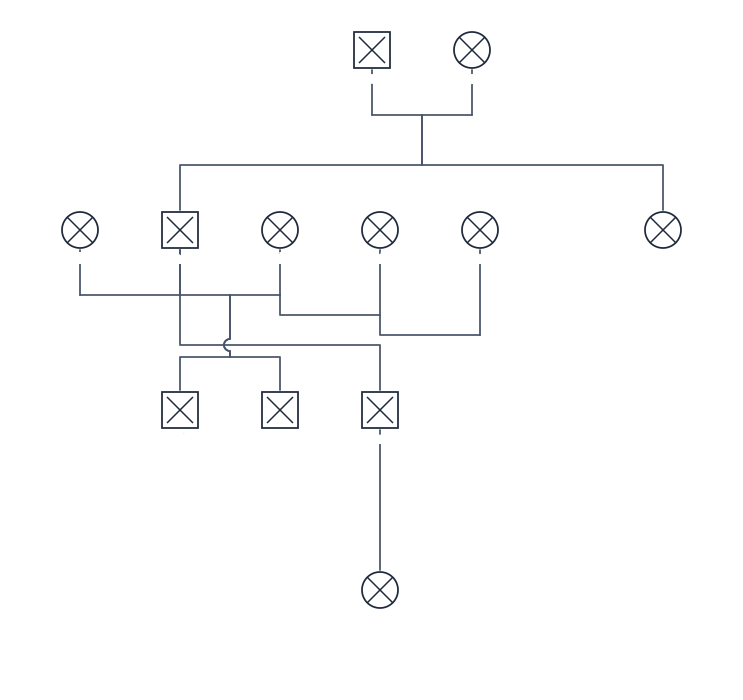
New Auto-Arrange
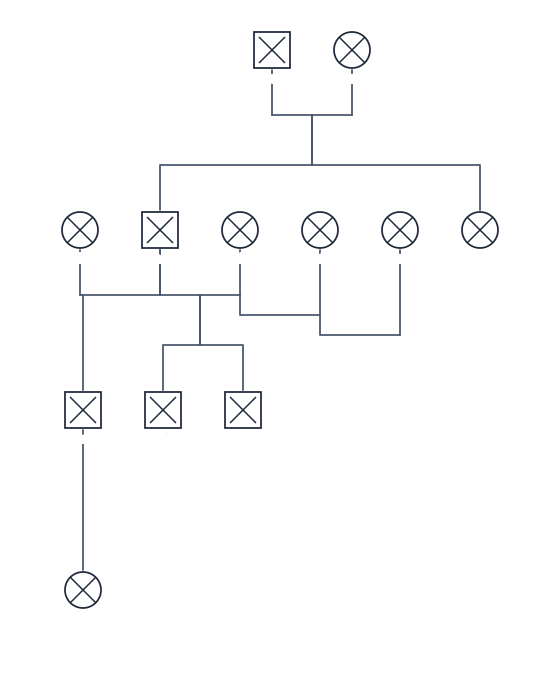
Original
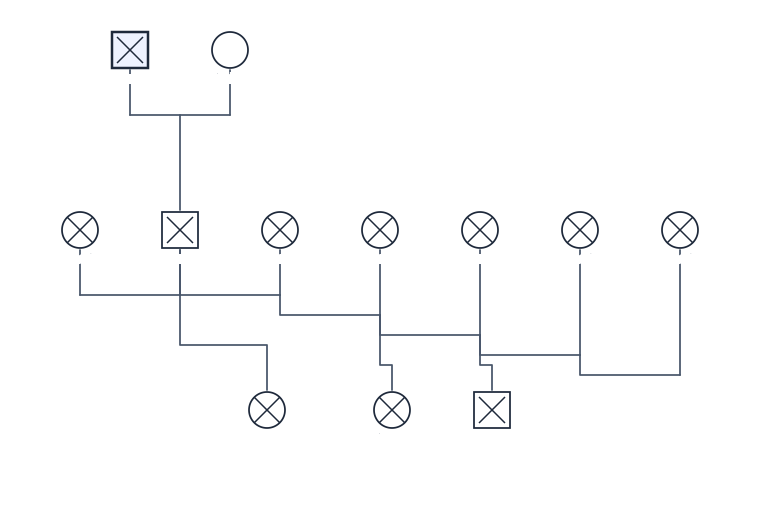
New Auto-Arrange
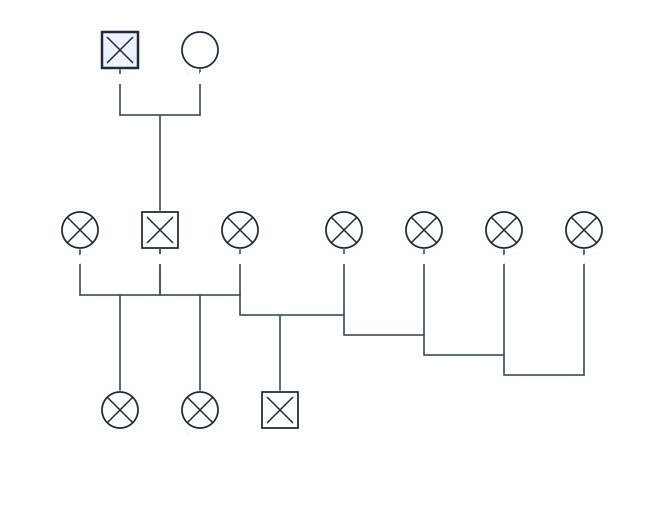
Original
New Auto-Arrange
Limitations and what’s next
Two measures got worse. Family lines that leave the couple’s line off-centre rose from 72 to 194. The chart still connects the right people, but the line can read as belonging to one parent more than the other. Siblings out of birth order rose from 140 to 169. Most of these (146 of 169) involve a sibling who married into another family on the same chart, where keeping the couple together without crossing lines currently comes at the expense of strict birth order. Both are the main targets of the next revisions.
It is slower. The median chart takes 4.3 ms instead of 1.1 ms, and the largest (about 1,000 people) take up to half a second. That is still well under the time it takes to notice on typical charts, but it is a real cost on very large ones.
Scores are a proxy. These measures capture the conventions we can count. They do not capture everything a clinician weighs, such as which side of the family a reader expects on the left. That is why each revision was also reviewed by eye.
The test set is not every family. Generated families and published examples cover a wide range of structures, but no test set covers every real family. We will keep adding harder cases and publish updated numbers as the engine changes.
The new Auto-Arrange is rolling out in the GenogramAI app now. You can always undo an arrange, and you can arrange part of a chart instead of the whole thing.
How to auto-arrange a genogram in GenogramAI
- Open your genogram in the GenogramAI app and click Auto-Arrange in the toolbar, or press Ctrl+Shift+A (Cmd+Shift+A on a Mac).
- Pick a layout: Tidy puts families side by side, and Compact gives the narrowest chart that keeps the conventions. Under More options you can set the space between people, and arrange only the people you have selected instead of the whole genogram.
- The panel tells you how many people will move before you apply it. Click Apply, and undo at any time with Ctrl+Z (Cmd+Z on a Mac) if you prefer what you had.
- Fine-tune by dragging anyone you want somewhere else.
After arranging, check the chart the way a reader would:
- Is the index person easy to find?
- Does every child hang from the right couple’s line, especially in a family with remarriages?
- Are partnerships in time order, with former partners on the outer side?
- Are siblings in birth order? Look closely at siblings who married into another family on the chart (see the limitations above).
- Are emotional lines and dates still readable, and is nothing hidden behind a symbol?
Files imported from genealogy software can be arranged the same way; see GEDCOM to genogram.
Frequently asked questions
How do you arrange a genogram with multiple marriages?+
Draw the partnerships in time order, earliest to most recent. When both people in the current couple were partnered before, a common arrangement puts each former partner on the outer side of the person they were with, so the current couple stays together. Mark divorces with two slashes and separations with one, and hang the children of each union from that union’s own line.
Where do half-siblings and step-siblings go on a genogram?+
Half-siblings hang from two different partnership lines of the parent they share, with each set under its own couple and the sets side by side in the order of the partnerships. Step-siblings share no parent; they are connected only through their parents’ new partnership, so they do not get a child line from the step-parent unless your key has a separate step-child line.
Is the man always on the left in a genogram?+
In a male–female couple the man is conventionally drawn on the left and the woman on the right. Same-sex couples have no fixed side, so choose a rule, such as the older partner on the left, and apply it consistently across the chart.
How many generations should a genogram include?+
Three generations around the index person is the usual clinical scope. For larger families, summarise branches that do not bear on the question in a note, or split the genogram across sheets, repeating the person who links them on both.
Can GenogramAI arrange a genogram automatically?+
Yes. Click Auto-Arrange in the toolbar or press Ctrl+Shift+A (Cmd+Shift+A on a Mac), choose Tidy or Compact, and apply. You can arrange only selected people, change the spacing, undo at any time, and drag anyone afterwards to fine-tune.
How was Auto-Arrange tested?+
On 199 test genograms with 6,875 people: generated families from 1 to about 1,000 people and the 158 genograms in our public example gallery. Each was laid out by the original and the new Auto-Arrange and scored for line crossings, couples, generations, birth order, overlaps, width and speed.
Try Auto-Arrange on your own genogram
Build a genogram, or import a GEDCOM file, then click Auto-Arrange.
Open GenogramAIMore research: all articles. Related: genogram symbols, how to make a genogram, GEDCOM to genogram.
Genogram notation based on the conventions described by McGoldrick, Gerson and Petry in Genograms: Assessment and Treatment (W. W. Norton). GenogramAI is an independent product and is not affiliated with or endorsed by the authors or the publisher.