Ecomaps
Four common mistakes when drawing an ecomap (and how to avoid them)
Quick answer
The ecomap has been a standard social-work tool since Ann Hartman developed it in 1975 (her paper describing it followed in 1978). Fifty years of clinical use have also produced fifty years of the same errors getting passed from one practitioner to the next. Most of these errors are not about misunderstanding the symbols. They come from the gap between drawing an ecomap and actually using it as a thinking tool. The canvas is fast to fill in; it takes more practice to fill it in usefully.
The four mistakes below are drawn from supervision patterns and the kinds of errors that turn up when clinicians share their canvases for review. They are not exotic edge cases. They are ordinary habits that erode the clinical value of the ecomap quietly, over many cases, until someone in supervision asks a question the diagram cannot answer.
Mistake 1: Drawing only what the client tells you
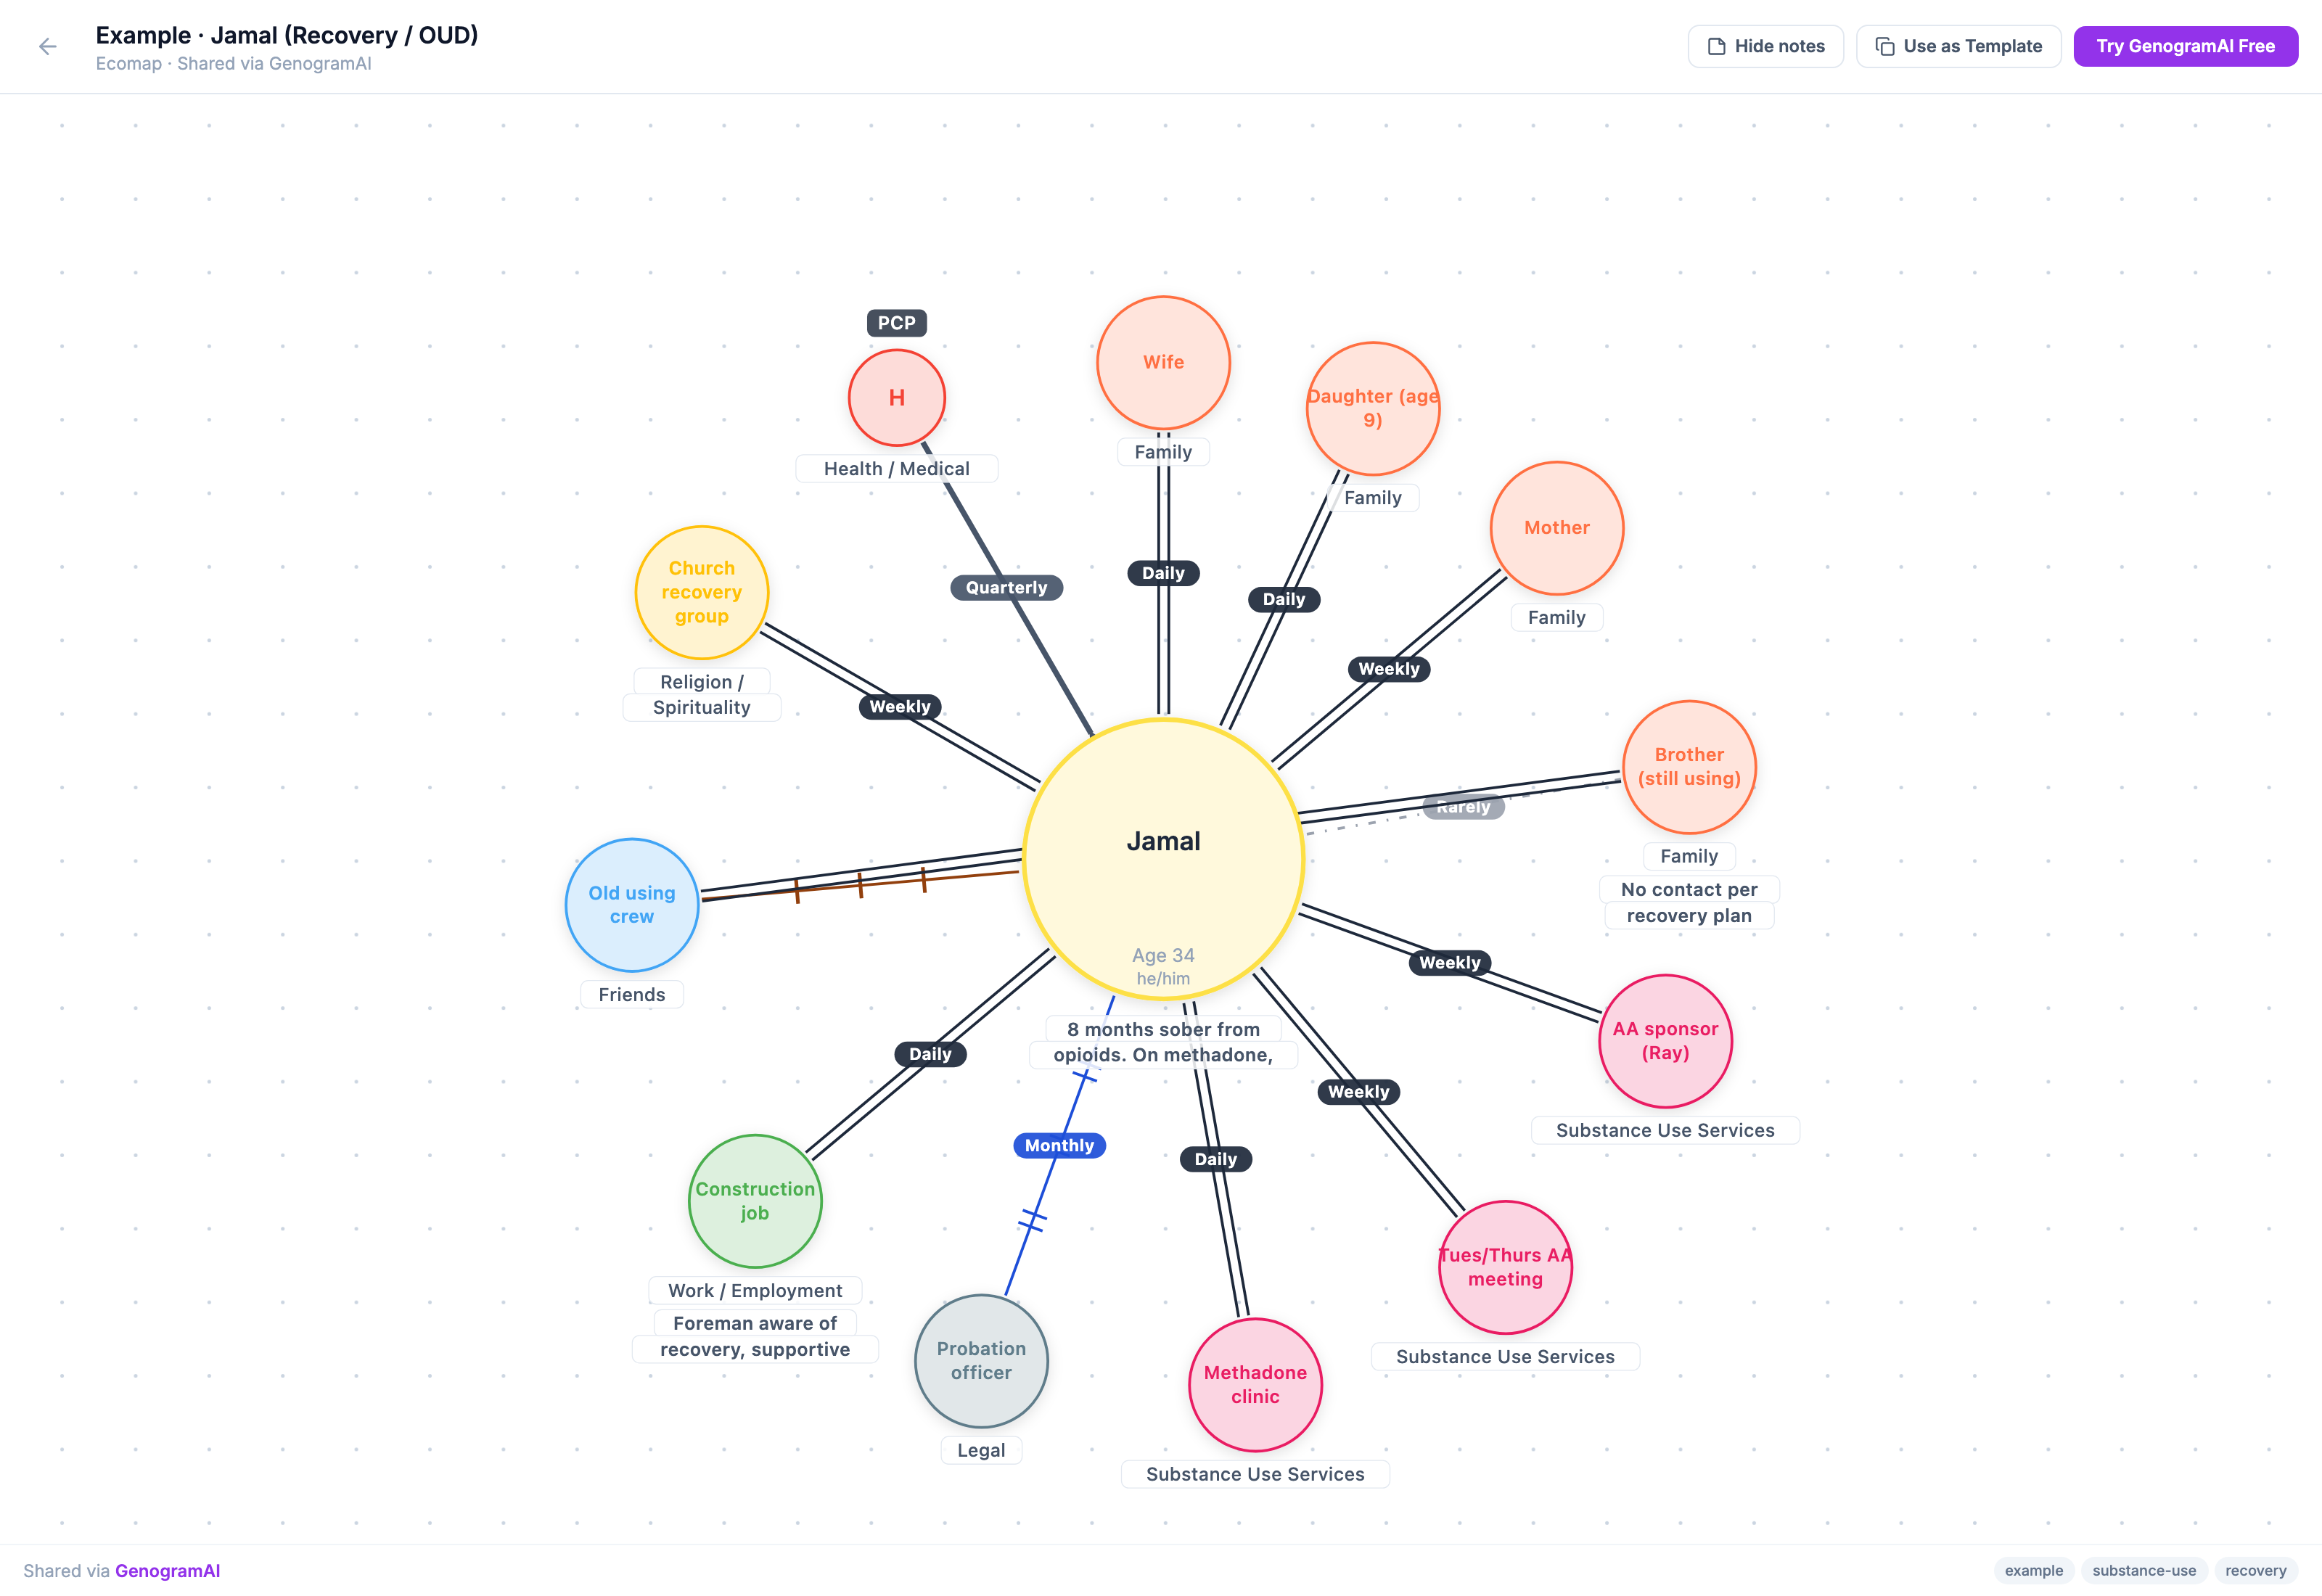
The client says “my family supports me” and the clinician draws three strong lines to mom, dad, and a sibling. Everyone moves on. But the client also spends 20 hours a week worrying about an estranged sibling, and that’s missing from the canvas because they didn’t volunteer it.
The fix
Mistake 2: Confusing “strong” with “close”
A close relationship and a strong relationship are not the same thing. A 22-year marriage with frequent fighting can be close (high contact, long history) but also stressful and strong at once. Drawing it as just “strong” misses half the clinical picture.
The fix
| Close? | Supportive? | Line style in the editor |
|---|---|---|
| Yes | Yes | Strong |
| Yes | No | Stressful + Strong |
| No | Yes (warm but distant) | Closer to Normal |
| No | No | Weak / Tenuous, or Broken / Cut-off |
Mistake 3: Treating the legend as decoration
Many clinicians skip the legend on exports, especially when sharing within a team. Six months later, when a different worker picks up the case, they have no idea what a zig-zag line means versus a dashed line versus a broken line. The ecomap is suddenly illegible.
The fix
| Line style | Drawn as | Meaning |
|---|---|---|
| Strong | A close, supportive, high-quality connection | |
| Normal | Present but not intense | |
| Weak / Tenuous | Fragile, occasional, or early-stage | |
| Stressful | Creates stress or strain | |
| Stressful + Strong | Close and stressful at once | |
| Conflictual | Active conflict or hostility | |
| Broken / Cut-off | Severed or estranged |
Mistake 4: Building it once and never updating it
An ecomap drawn at intake captures the client’s world at one moment. Three months in, that world has shifted: new prescriber, lost job, new partner, strengthening recovery network. The intake ecomap in the chart is now actively misleading anyone who reads it as current.
The fix
All four mistakes at a glance
| Mistake | What it causes | How to spot it | Fix |
|---|---|---|---|
| Drawing only what the client tells you | Missing draining relationships and institutions | Only family and friends on the canvas; no health, legal, work or money systems | Three explicit prompts after the first pass |
| Confusing strong with close | Conflicted bonds drawn as purely supportive | Long, high-contact relationships all drawn as plain strong lines | Ask "close?" and "supportive?" separately |
| Treating the legend as decoration | The next reader cannot decode the lines | Exports and attachments with no key | Attach the legend to everything you share |
| Never updating it | A chart that reads as current but is months out of date | One ecomap in the file, dated at intake | Redraw at 30, 60, 90 days and at reviews; keep versions |
One thing that doesn’t make this list
People sometimes assume “not enough systems” is a mistake. It isn’t necessarily. A sparse ecomap (3–5 systems, a few weak lines) is its own data point. It tells you about isolation, low social capital, or limited service engagement. Don’t pad a sparse ecomap to make it look thorough; let the sparseness be the signal.
The meta-mistake
The biggest mistake is treating the ecomap as a documentation chore instead of a conversation tool. The diagram itself isn’t the output. The conversation it generates (the things the client says about their relationships when they see them visualized) is the output. Draw it together, talk through it as you go, leave space for the client to revise their own categorization. The canvas is just a prop for the dialogue.
This reframe changes what a “good” ecomap looks like. A good ecomap is not one that looks tidy and complete. It is one that prompted the client to say something they would not have said otherwise. Sometimes that is naming an estranged sibling they’d been avoiding thinking about. Sometimes it is realizing, for the first time while looking at a diagram, that every arrow in their life points inward: they receive support from everyone and give nothing back, which is its own kind of clinical signal.
When you review an ecomap you drew six months ago and cannot remember a single thing the client said while you built it, that is a sign the ecomap was documentation. When you review it and remember three specific moments where the client said something that changed how you understood their situation, that is a sign you used it as a tool. The goal is the second version. The four mistakes above all work against it in different ways: they produce diagrams that are easier to draw but harder to learn from.
Frequently asked questions
What are the lines on an ecomap?
Ecomap lines show the quality of each connection between the person at the centre and a system around them. A thick solid line is strong, a thin solid line is normal, a dashed line is weak or tenuous, a zig-zag is stressful, a double zig-zag is stressful and strong, a line with hash marks is conflictual, and a line interrupted by a cross is broken or cut off. Arrows show which way energy or resources flow.
What is the most common ecomap mistake?
Drawing only the systems the client volunteers. Clients name the people who feel important and forget institutions and draining relationships. After the first pass, ask who else takes up energy and which services or institutions touch their week.
Does an ecomap need a legend?
Any ecomap that leaves your hands should carry one. Without a legend, the next worker on the case cannot tell a zig-zag from a dashed or broken line. GenogramAI adds an on-canvas legend that updates as you use line styles; if you draw by hand, photograph the legend along with the diagram.
How often should you update an ecomap?
Re-do it on a schedule, for example at 30, 60 and 90 days and then at every case-plan review. Save each version instead of overwriting, because the comparison between ecomaps is often more clinically useful than any single snapshot.
Try it