Couples Therapy: Affair, Separation and Two Families of Origin
Couples genogram with an affair, separation and reconciliation, both families of origin, a repeated affair pattern and a parent-child triangle.
Interactive Couples Therapy: Affair, Separation and Two Families of Origin
Click and drag to explore. Zoom with scroll.
Can't see the genogram? View in the GenogramAI Gallery
About This Genogram
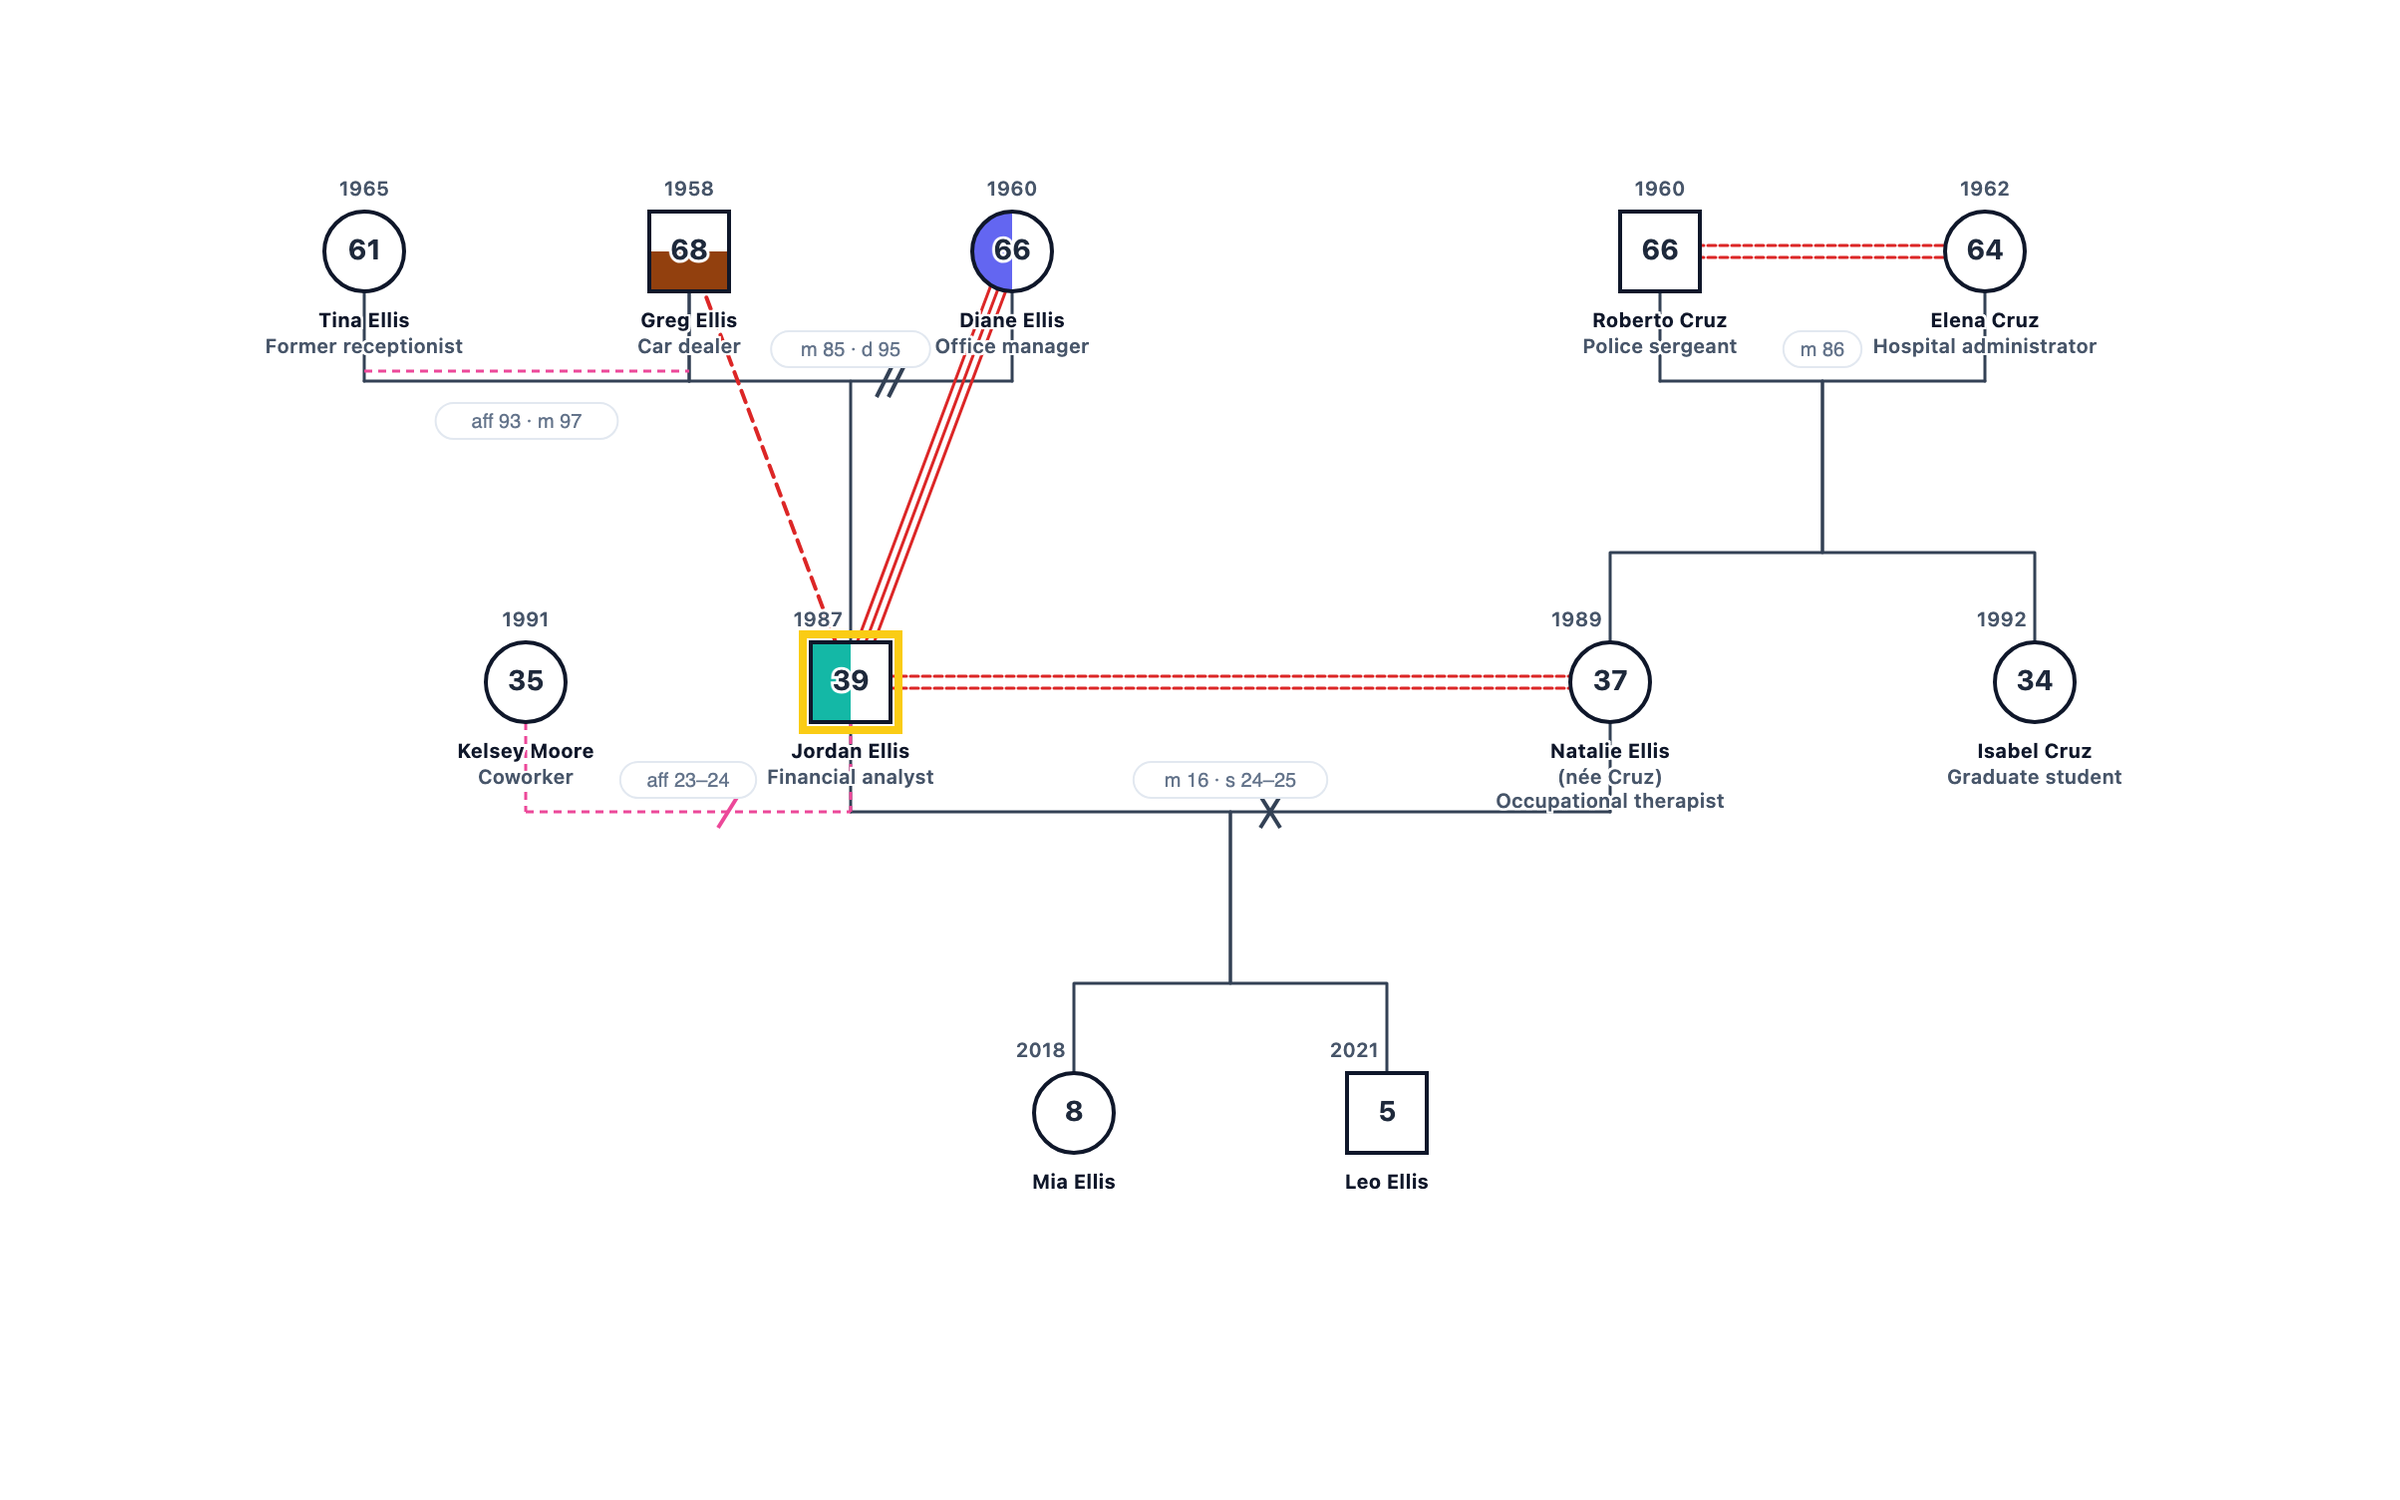
A couples therapy genogram of a fictional couple who separated after an affair and reconciled a year later, drawn with both partners’ families of origin. It shows a repeated affair pattern from the husband’s father, a high-conflict marriage that never separated on the wife’s side, couple history on the line (married, separated, reconciled) and a triangle with their daughter.
How to Read This Genogram
Clinicians typically introduce this type of genogram during an intake assessment to build a three-generation picture of the family before treatment planning begins. The map helps the therapist apply Bowen Family Systems Theory by locating triangles, differentiation levels, and the emotional processes that link presenting symptoms to earlier family patterns. Squares represent male family members, circles represent female family members, horizontal lines connect couples, and vertical lines descend to their children. Dates near symbols mark births, marriages, separations, and deaths, giving the reader a timeline of key family transitions.
Multigenerational transmission patterns become visible when you trace the same relational or behavioral theme across two or more generations. A therapist reading this genogram looks for repetitions in relationship roles, anxiety management strategies, and symptom locations that span grandparents, parents, and the current generation. Identifying those threads allows the clinician to distinguish what belongs to the individual from what was absorbed from the family system, which is often the first step toward lasting change in family or individual therapy.
Key Patterns in This Genogram
Multigenerational Transmission
How conditions and behaviors are passed across generations through family dynamics.
Emotional Relationships
Patterns of enmeshment, cutoff, conflict, and closeness between family members.
Family System Dynamics
How the family operates as a system with roles, boundaries, and recurring patterns.
Clinical Analysis
Jordan (39) and Natalie (37) Ellis married in 2016 and have two children, Mia (8) and Leo (5). In 2024 Natalie found messages showing that Jordan had been having an affair with a coworker, Kelsey, since 2023. They separated for 11 months, reconciled in 2025 and started couples therapy.
Jordan’s family of origin contains the same event a generation earlier. His father Greg began an affair with Tina in 1993, divorced Jordan’s mother Diane in 1995 and married Tina in 1997. Jordan, then 8, became Diane’s confidant (fused line) and grew distant from Greg. Natalie’s parents, Roberto and Elena, have a long, openly conflictual marriage; Natalie, the elder daughter, learned to manage conflict by staying close to her mother.
The genogram helps the couple see the affair as more than an individual failing. Jordan repeated his father’s pattern while believing he was nothing like him; Natalie’s first instinct was to pull Mia close, forming the detouring triangle shown on the chart. Therapy can address the repair of trust and these inherited patterns together.
Build a Similar Genogram
A practitioner documenting a family similar to this one would typically record three generations of household composition, significant life events such as births, deaths, marriages, and separations, any relevant medical or mental health history, and the quality of key relationships between members. That information comes from a combination of the client's verbal account, intake questionnaires, and, where available, collateral records. The completed diagram captures both the factual structure of the family and the practitioner's clinical observations about relational patterns, making it a reference that can be shared across disciplines or reviewed at future stages of treatment.
GenogramAI's AI genogram generator allows you to build a diagram like this one from a plain-language description of the family. You type or paste a narrative, such as the basic structure and any key relationships or health history you want to include, and the AI parses that text, places the correct symbols, draws the appropriate relationship lines, and arranges the layout automatically. The result is a fully editable diagram that you can refine, annotate, and export for clinical records or educational use. Try the AI genogram creator to generate your own genogram from a text description in seconds.
Genogram Symbols Used in This Example
The following standard genogram symbols appear in the Couples Therapy: Affair, Separation and Two Families of Origin. Each symbol follows McGoldrick and Gerson clinical notation conventions.
Person Symbols
- Male (Square)
- A square represents a male family member.
- Female (Circle)
- A circle represents a female family member.
- Index person (highlighted outline)
- The person at the centre of the assessment is drawn with a highlighted outline.
- Age inside the symbol
- The current age (or age at death) is written inside each symbol, with years above it.
Couples
- Marriage
- A solid line between partners; the marriage year is written on the line (m 90 = married 1990).
- Divorce
- Two slashes across the couple line mark a divorce, with the year (d 02).
- Separation
- One slash across the couple line marks a separation (s 80).
- Reconciled
- A separation slash crossed back marks a couple who separated and then reconciled (s 24–25).
- Affair
- A pink dashed line marks an affair, labelled with the years it started and ended.
Emotional Relationships
- Fused
- Three parallel lines mark an over-close, fused relationship.
- Distant
- A dashed line marks emotional distance.
- Conflict
- Dashed red double lines mark open conflict.
Medical
- Medical shading
- The left half of a symbol is shaded for a physical or mental illness and the bottom half for alcohol or drug use; each condition has its own colour, listed in the key. Hatching means suspected, a partial fill means in recovery.
Related Resources
- Read our guide to genograms in couples therapy.
- Greg and Diane’s line uses the divorce symbol.
- An attachment theory genogram looks at the same patterns through attachment styles.
- The fused relationship symbol marks Jordan’s role as his mother’s confidant.
Frequently Asked Questions
Why draw both families of origin in couples therapy?
How is an affair drawn?
How do you show a separation followed by reconciliation?
What is a detouring triangle?
Related Genogram Examples
Okafor Family Genogram
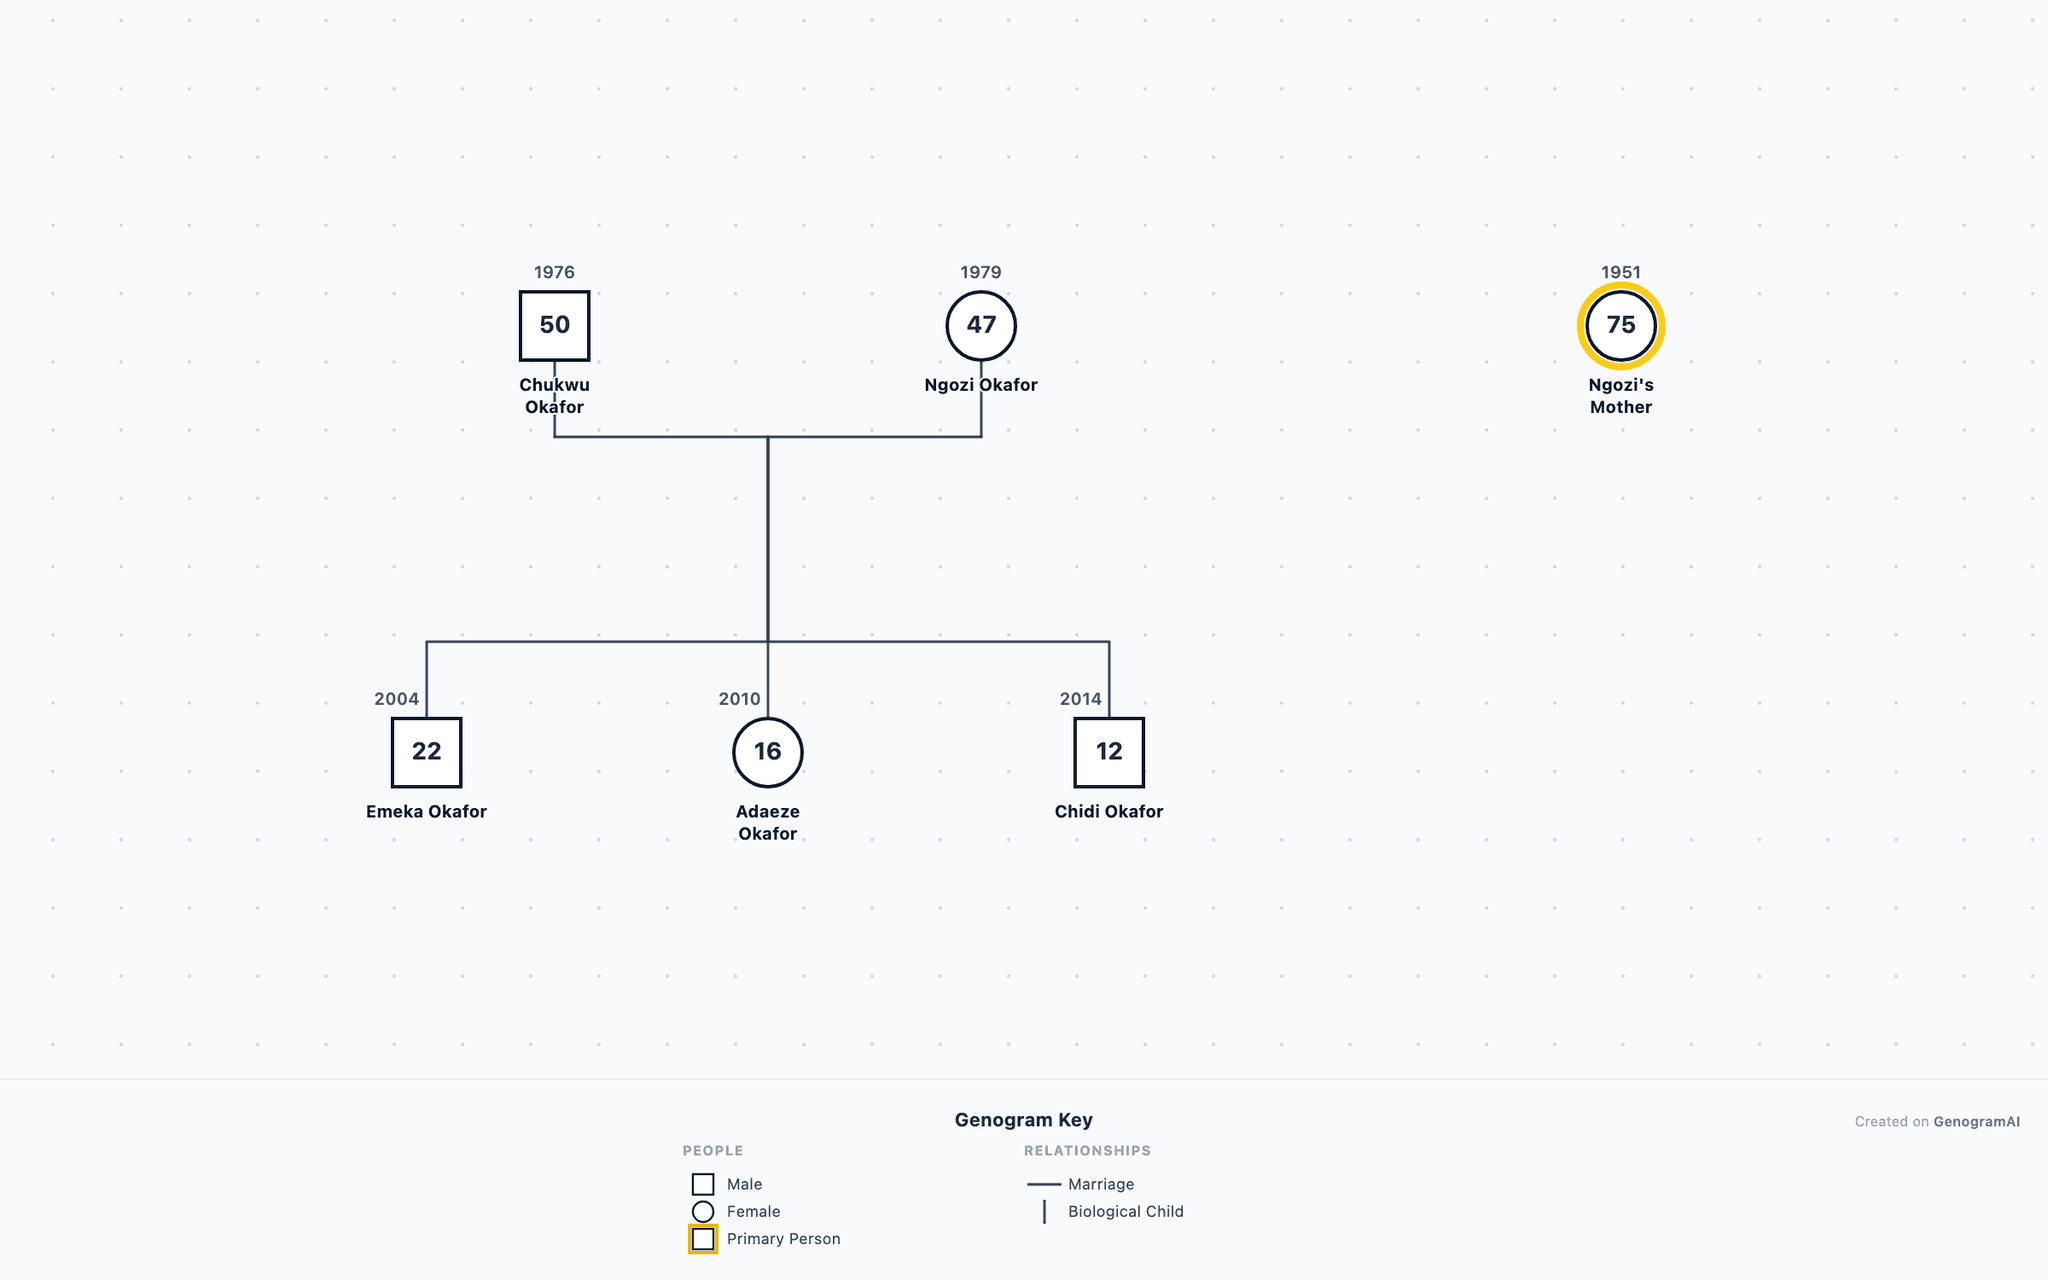
Adaeze Okafor, 16, is brought to therapy by her parents, Chukwu (50) and Ngozi (47), for \"defiant behavior.
Brennan-Mitchell Family Genogram
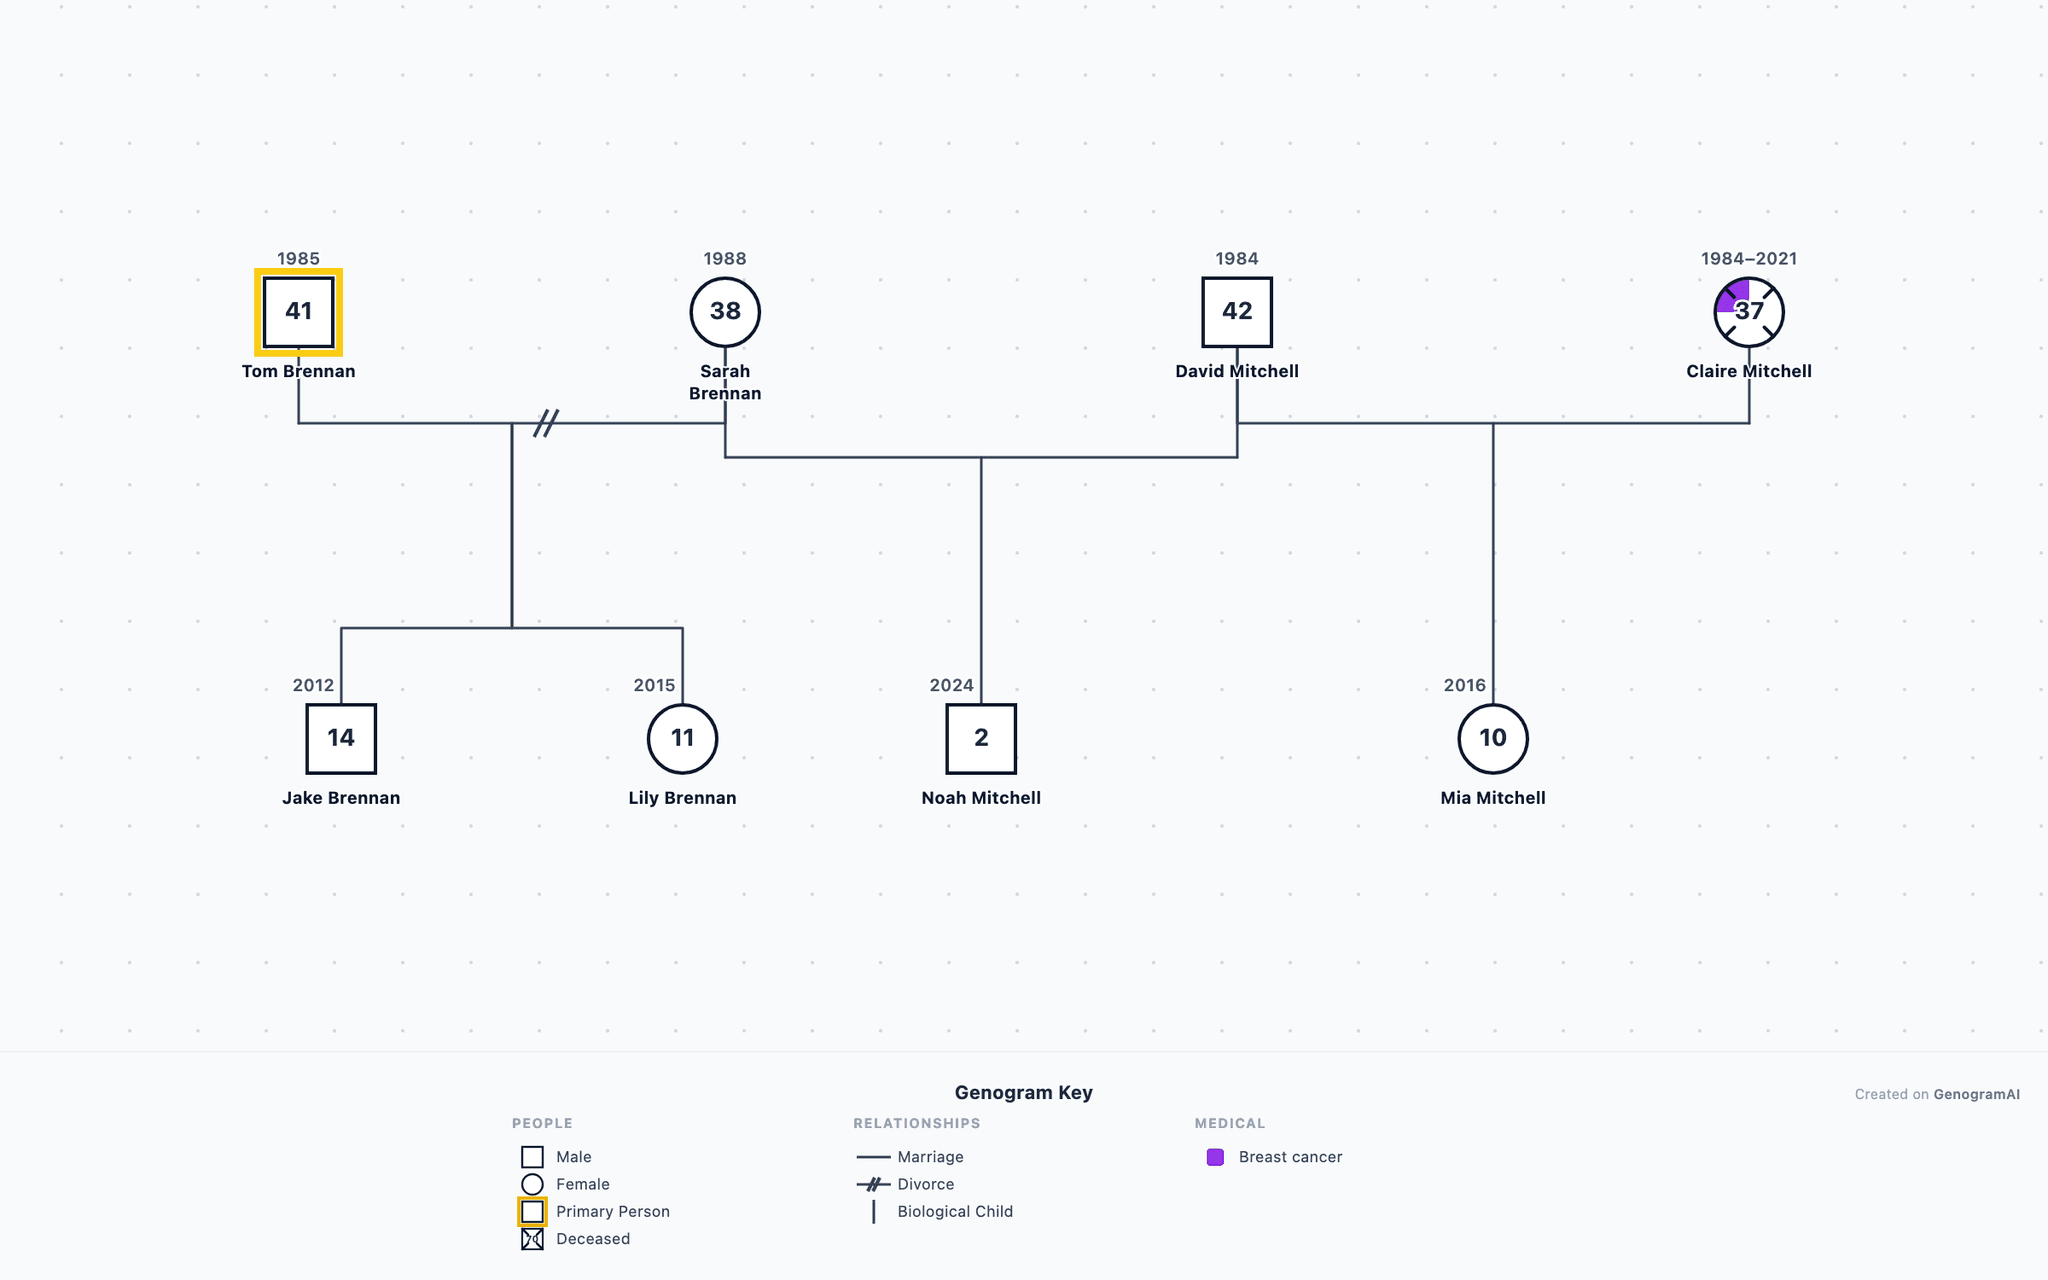
Sarah Brennan (38) and David Mitchell (42) present for couple therapy, reporting constant conflict about parenting. They have been married for three years.
Kim-Alvarez Family Genogram
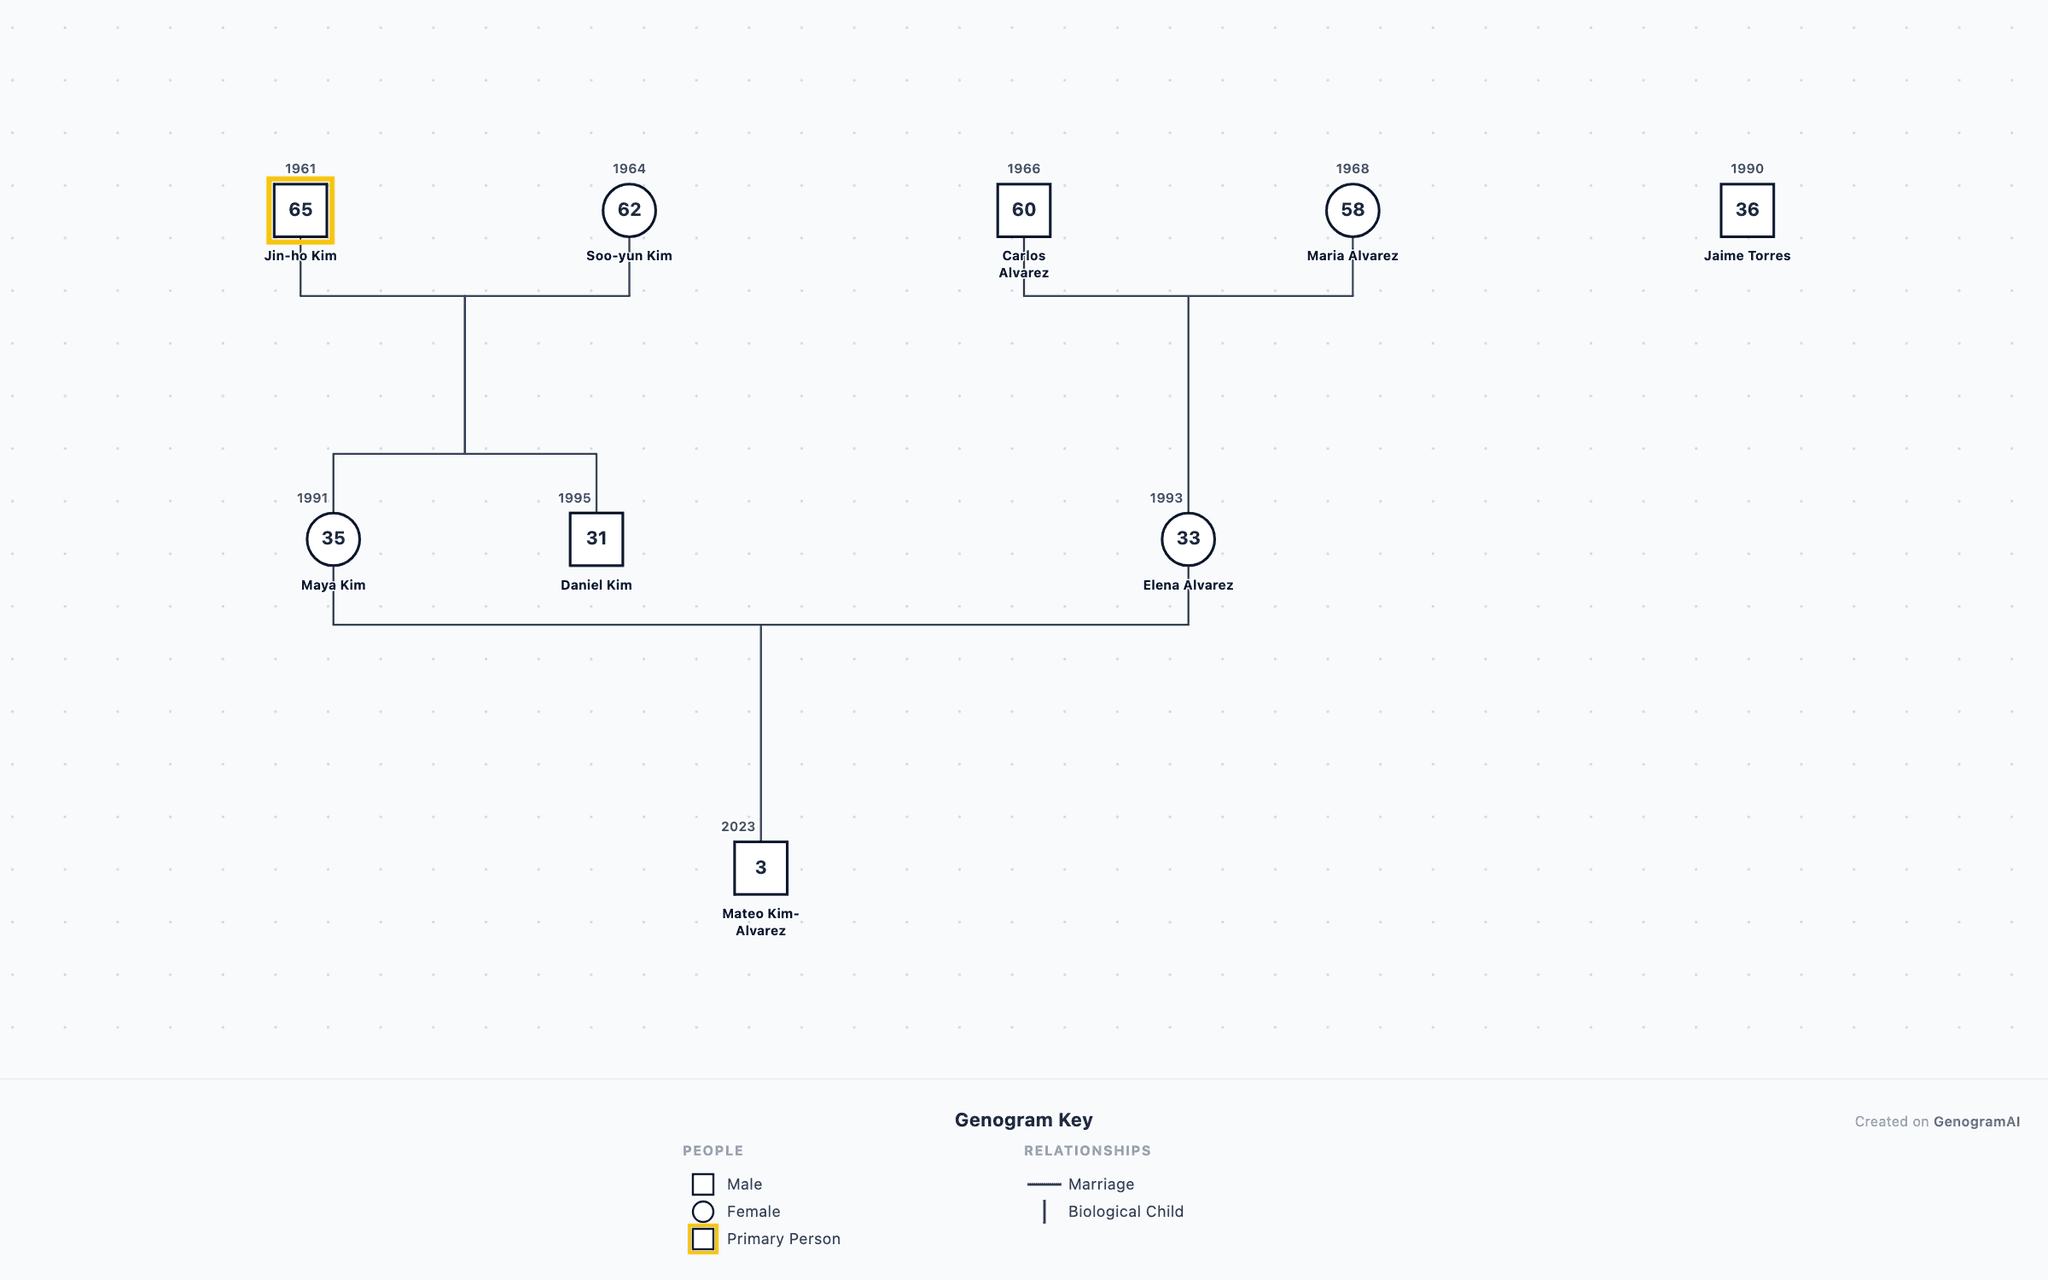
Maya Kim (35) and Elena Alvarez (33) present for family therapy.
Create Your Own Genogram
Use GenogramAI to build your own family genogram with AI assistance. Describe your family and let AI do the rest.
Educational disclaimer: This genogram example is an educational illustration of genogram notation and family systems concepts. Examples based on public figures use publicly available information. They are not clinical documents. All examples are intended for learning genogram symbols and patterns.