Child with Down Syndrome: Family Adaptation
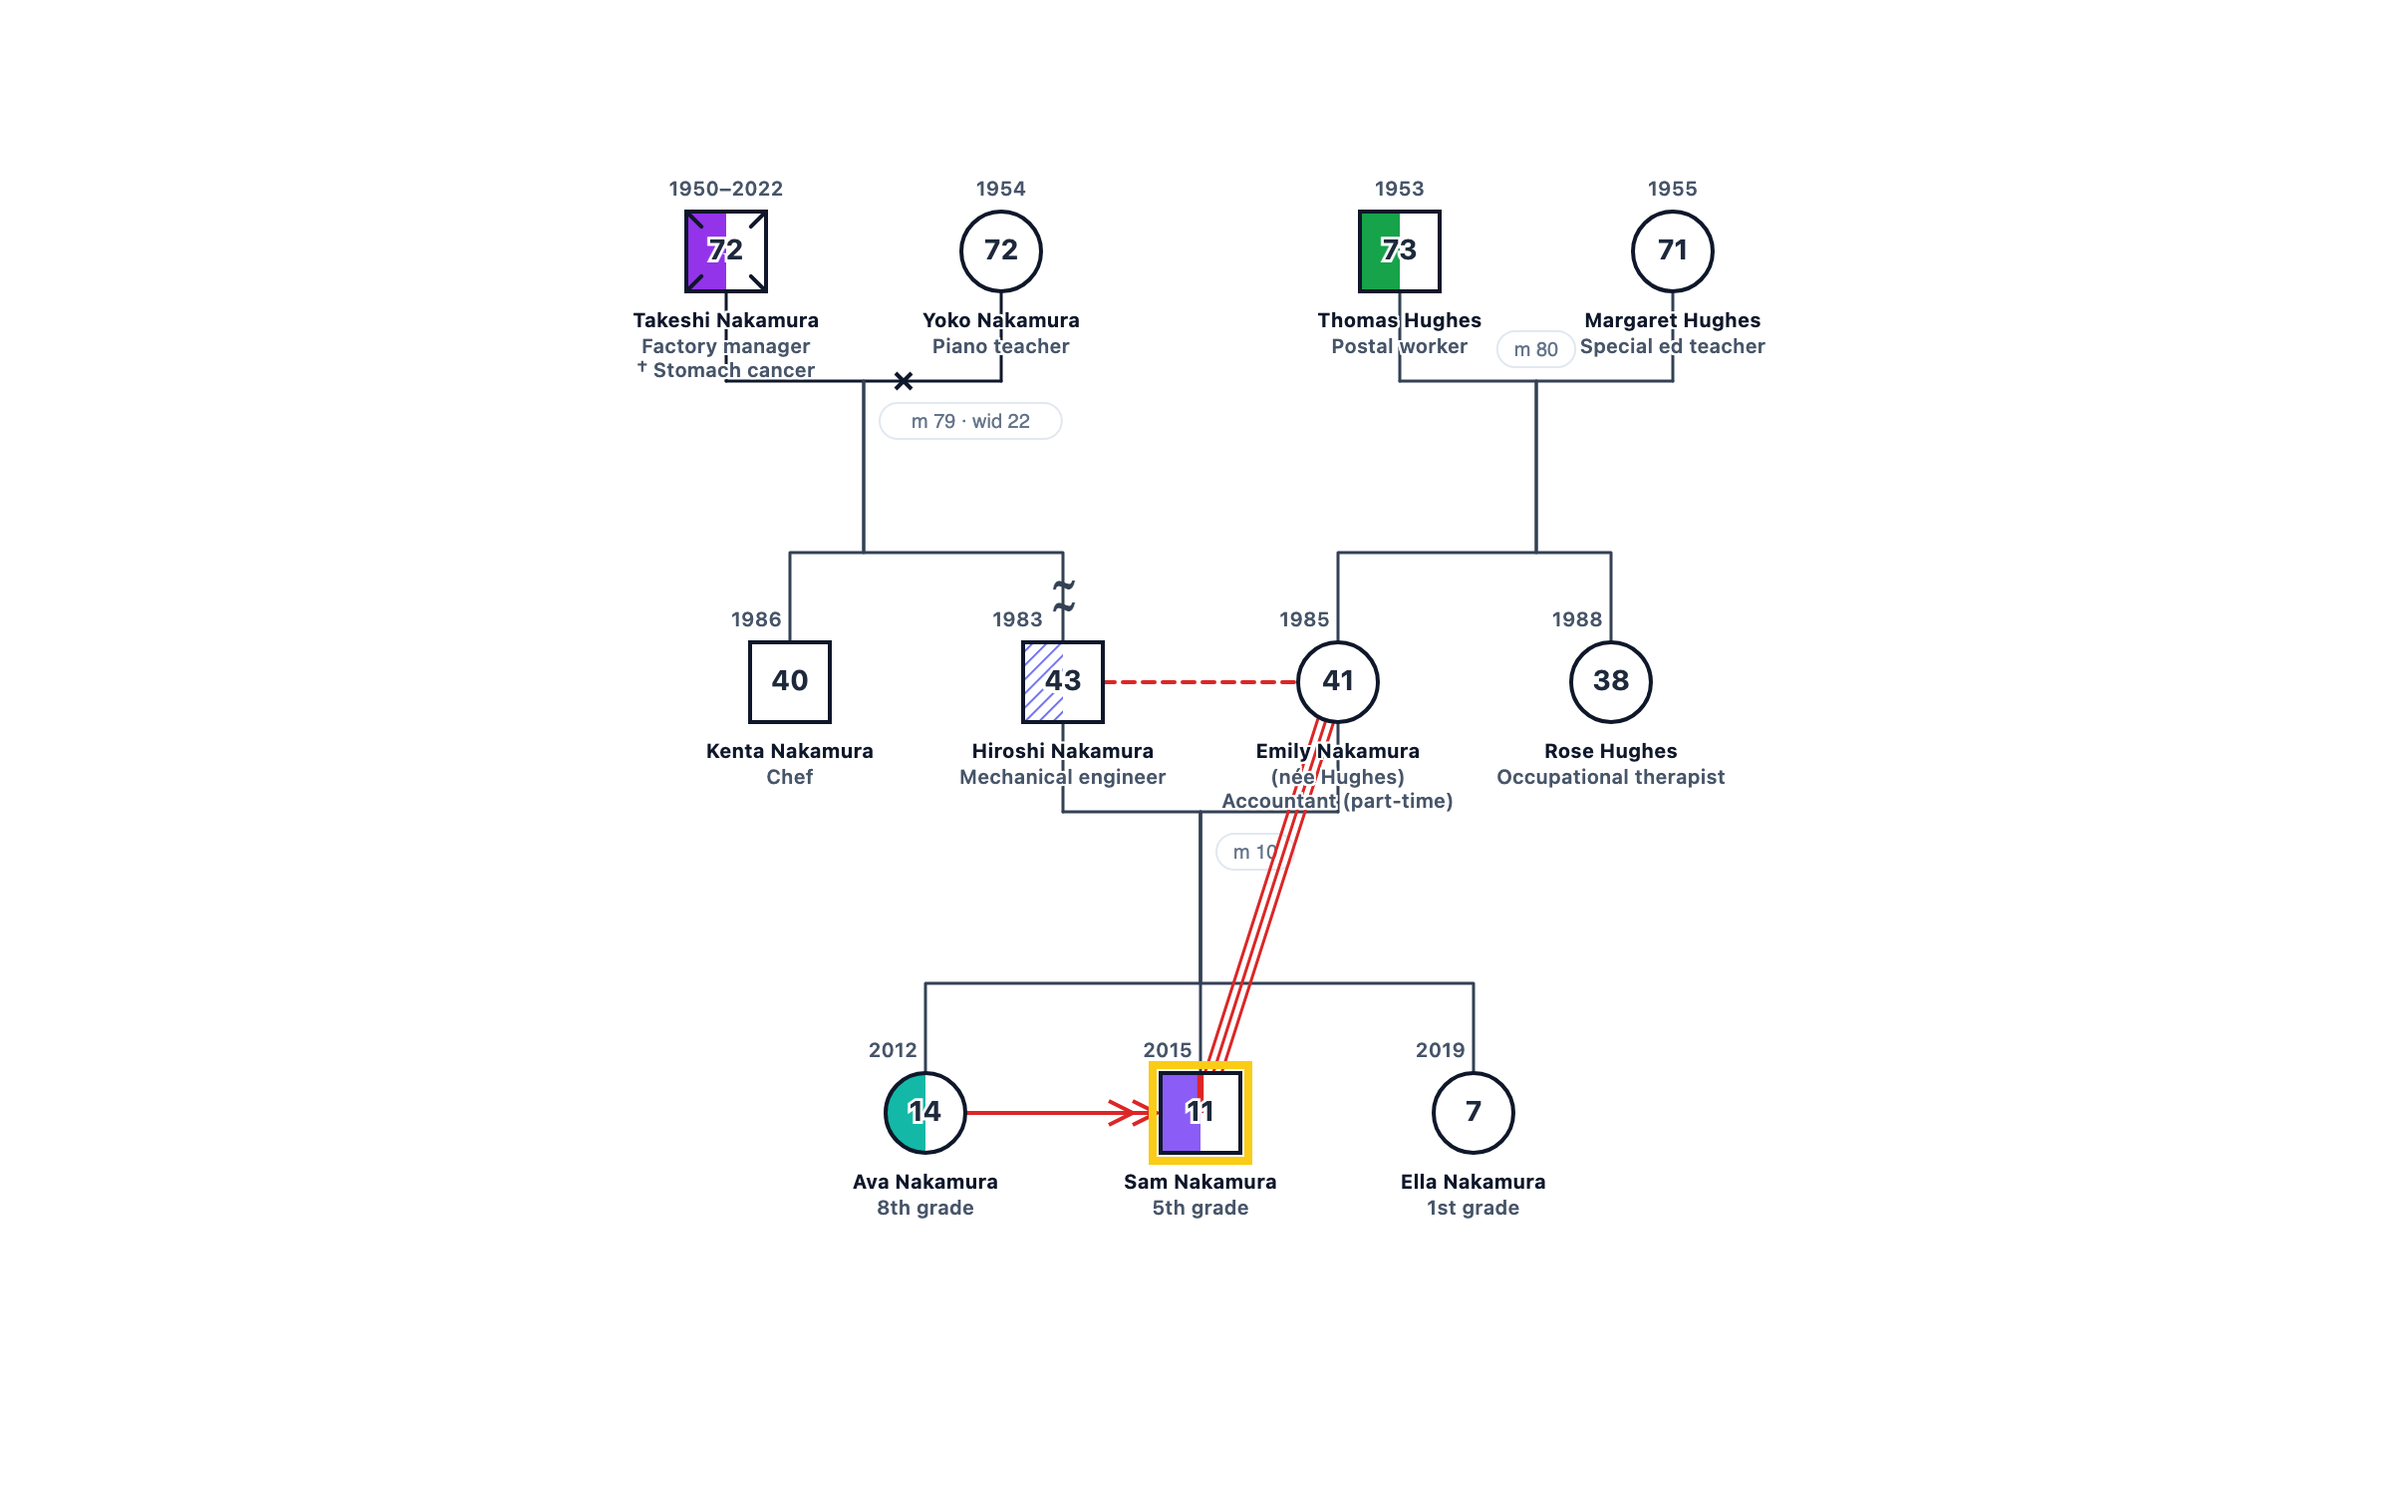
Genogram of a family raising a child with Down syndrome: genetic and heart conditions, sibling caretaking, parent stress and grandparent support.
Interactive Child with Down Syndrome: Family Adaptation
Click and drag to explore. Zoom with scroll.
Can't see the genogram? View in the GenogramAI Gallery
About This Genogram
A three-generation genogram of a fictional Japanese-American family adapting to a son with Down syndrome and a repaired heart defect. It shows the genetic condition and cardiac history with medical shading, a mother-son fused bond, an older sister in a caretaking role, a distant father with suspected depression and grandparents on both sides.
How to Read This Genogram
A medical or hereditary genogram uses the same basic symbols as a clinical genogram but adds shading and annotation to track health conditions across generations. Quadrant shading inside a square or circle indicates that the individual carries or has been diagnosed with a specific condition, and a key in the corner of the diagram maps each shading pattern to a particular illness or genetic variant. Reading this diagram from top to bottom reveals which conditions appeared first, which generation carried them forward, and which branches of the family show the heaviest disease burden.
Pedigree analysis in genetic counseling follows a similar structure. A counselor scans the diagram horizontally across each generation to assess prevalence, then traces diagonally to detect autosomal dominant, autosomal recessive, or X-linked inheritance patterns. When multiple individuals in a direct line share a condition, the genogram supports a hereditary hypothesis. When distribution is scattered and skips generations, environmental or multifactorial causes move higher on the differential. This visual summary allows a genetic counselor or primary care physician to communicate complex family health history in a single diagram rather than several pages of narrative notes.
Key Patterns in This Genogram
Hereditary Risk Factors
Genetic and hereditary conditions tracked across multiple generations.
Disease Patterns
How medical conditions cluster and recur within the family tree.
Preventive Insights
Identifying at-risk individuals based on family health history patterns.
Medical Analysis
Sam Nakamura (11) was born in 2015 with Down syndrome and an atrioventricular septal defect that was repaired at four months. He is in 5th grade in an inclusive classroom. His parents are Hiroshi (43), a mechanical engineer who immigrated from Japan, and Emily (41), an accountant who moved to part-time work after Sam was born. His sisters are Ava (14) and Ella (7).
The emotional lines show a common pattern in families caring for a child with high needs: a fused mother-child bond, a father who has drifted to the edge of family life (Hiroshi’s depression is marked as suspected) and an older sibling who has taken on a caretaking role. Ava’s anxiety is a signal that her own needs may be overlooked.
Supports are visible as well. Emily’s mother Margaret is a retired special education teacher and her sister Rose is an occupational therapist. On Hiroshi’s side, his father Takeshi died in 2022 and Hiroshi did not travel to the funeral, an unfinished loss that may connect to his withdrawal. A nurse or OT can use the chart to bring Hiroshi back into Sam’s care and to arrange support for Ava.
Build a Similar Genogram
A practitioner documenting a family similar to this one would typically record three generations of household composition, significant life events such as births, deaths, marriages, and separations, any relevant medical or mental health history, and the quality of key relationships between members. That information comes from a combination of the client's verbal account, intake questionnaires, and, where available, collateral records. The completed diagram captures both the factual structure of the family and the practitioner's clinical observations about relational patterns, making it a reference that can be shared across disciplines or reviewed at future stages of treatment.
GenogramAI's AI genogram generator allows you to build a diagram like this one from a plain-language description of the family. You type or paste a narrative, such as the basic structure and any key relationships or health history you want to include, and the AI parses that text, places the correct symbols, draws the appropriate relationship lines, and arranges the layout automatically. The result is a fully editable diagram that you can refine, annotate, and export for clinical records or educational use. Try the AI genogram creator to generate your own genogram from a text description in seconds.
Genogram Symbols Used in This Example
The following standard genogram symbols appear in the Child with Down Syndrome: Family Adaptation. Each symbol follows McGoldrick and Gerson clinical notation conventions.
Person Symbols
- Male (Square)
- A square represents a male family member.
- Female (Circle)
- A circle represents a female family member.
- Index person (highlighted outline)
- The person at the centre of the assessment is drawn with a highlighted outline.
- Deceased (X)
- An X through the symbol marks a person who has died; birth and death years are written above it.
- Age inside the symbol
- The current age (or age at death) is written inside each symbol, with years above it.
Couples
- Marriage
- A solid line between partners; the marriage year is written on the line (m 90 = married 1990).
- Widowed
- A small x on the couple line marks the end of a marriage through death (wid 15).
- Immigration marker
- A double wavy mark on a person’s line records immigration; a single wavy mark records living across two cultures.
Emotional Relationships
- Fused
- Three parallel lines mark an over-close, fused relationship.
- Distant
- A dashed line marks emotional distance.
- Caretaking
- An arrow from the caregiver to the person cared for marks a caretaking role.
Medical
- Medical shading
- The left half of a symbol is shaded for a physical or mental illness and the bottom half for alcohol or drug use; each condition has its own colour, listed in the key. Hatching means suspected, a partial fill means in recovery.
Related Resources
- Read about genograms for occupational therapy.
- See how genograms and ecomaps in nursing support family assessment.
- Learn how to build a medical genogram.
- Ava’s role is drawn with the caretaker relationship symbol.
Frequently Asked Questions
How does a genogram help families of children with disabilities?
How are medical conditions shown?
Is Down syndrome inherited?
What does the caretaking arrow from Ava mean?
Related Genogram Examples
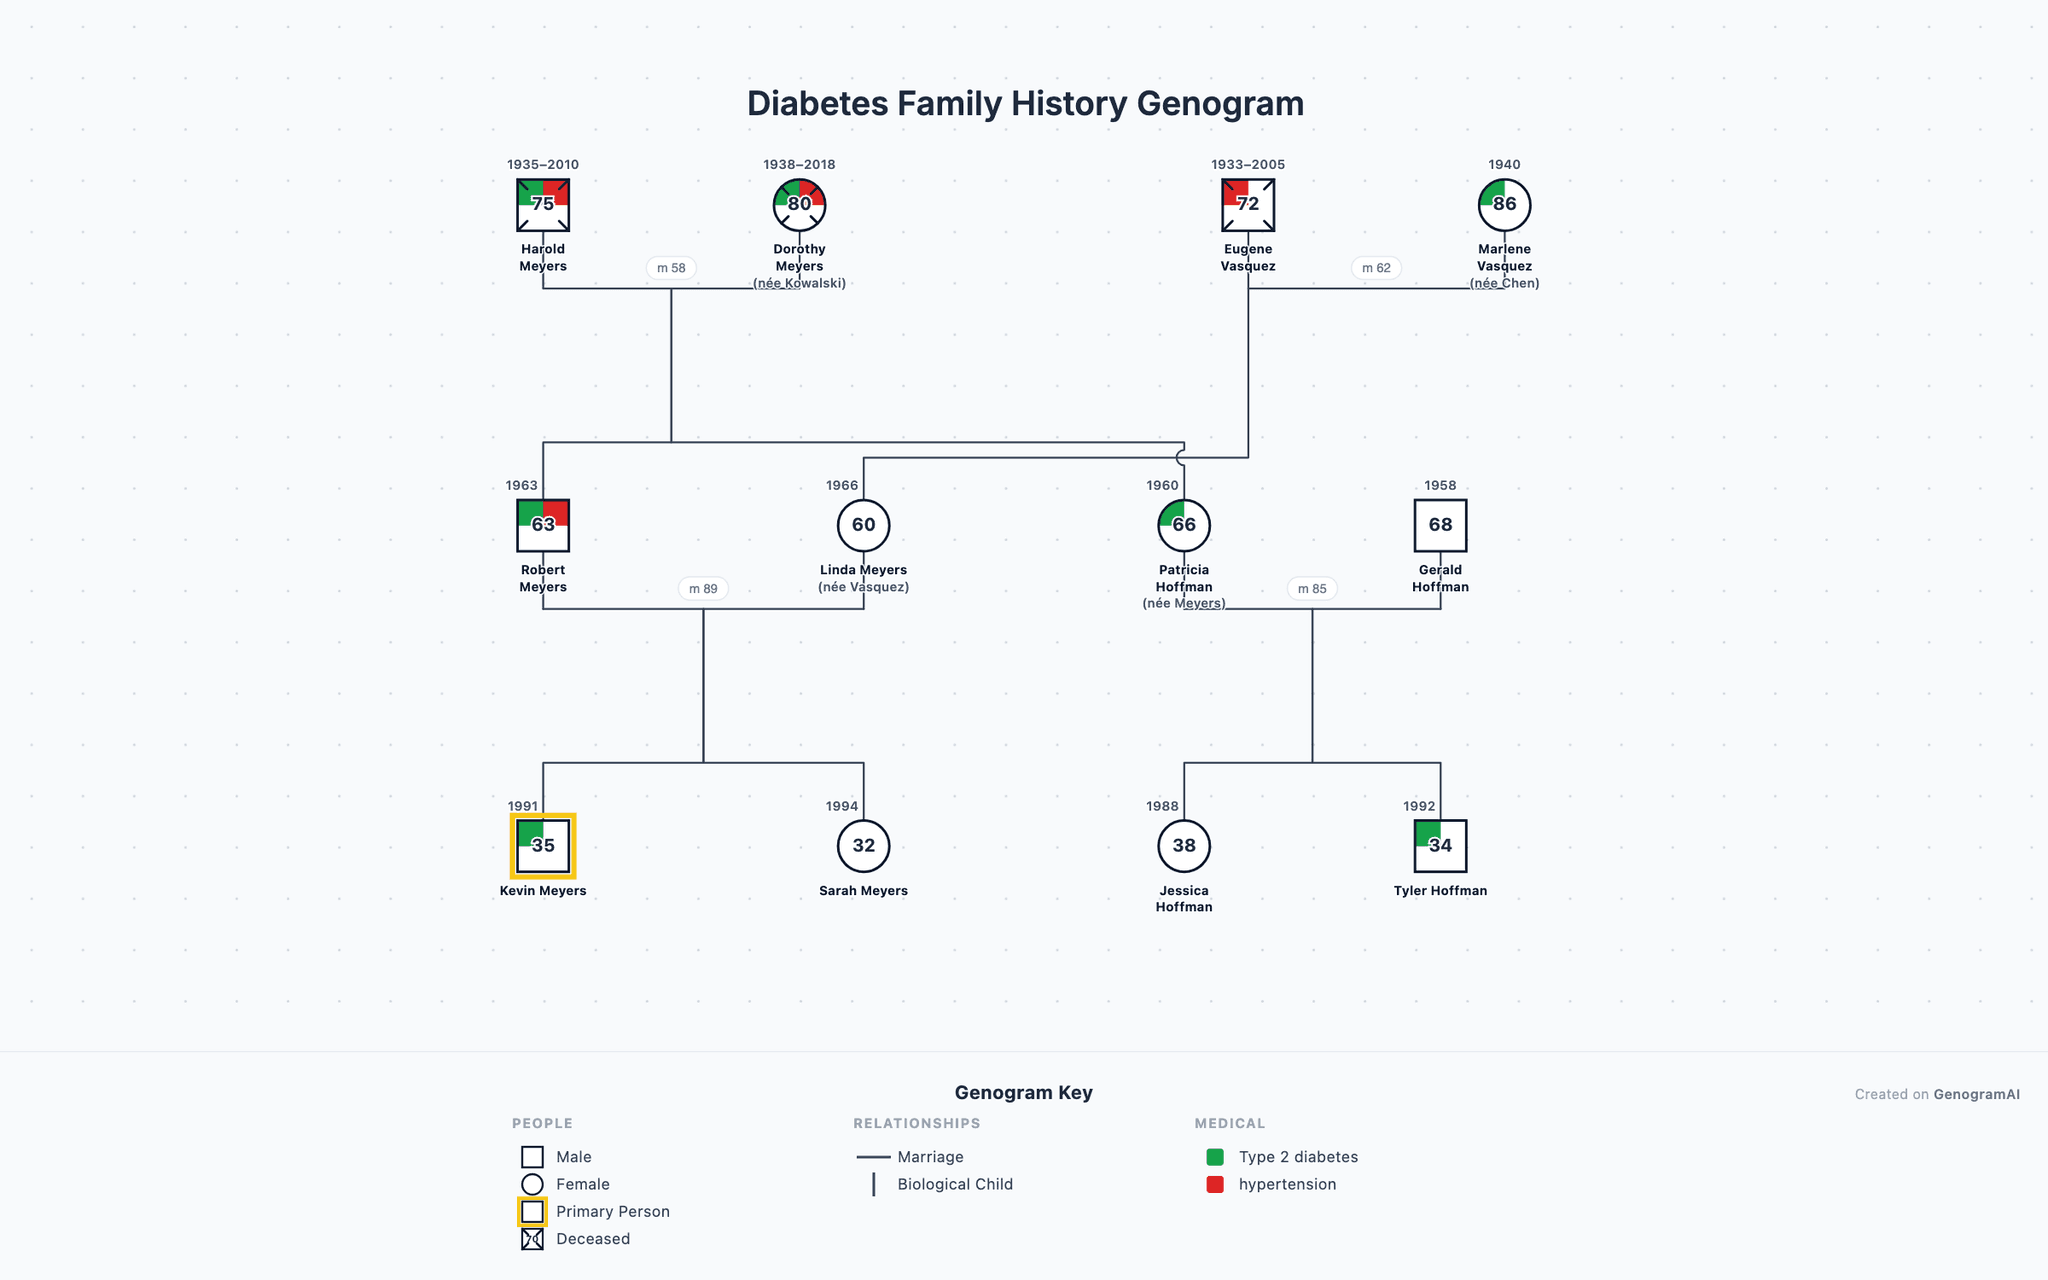
Diabetes Family History Genogram
A three-generation genogram illustrating the clustering of Type 2 diabetes within a family, including comorbid cardiovascular conditions.
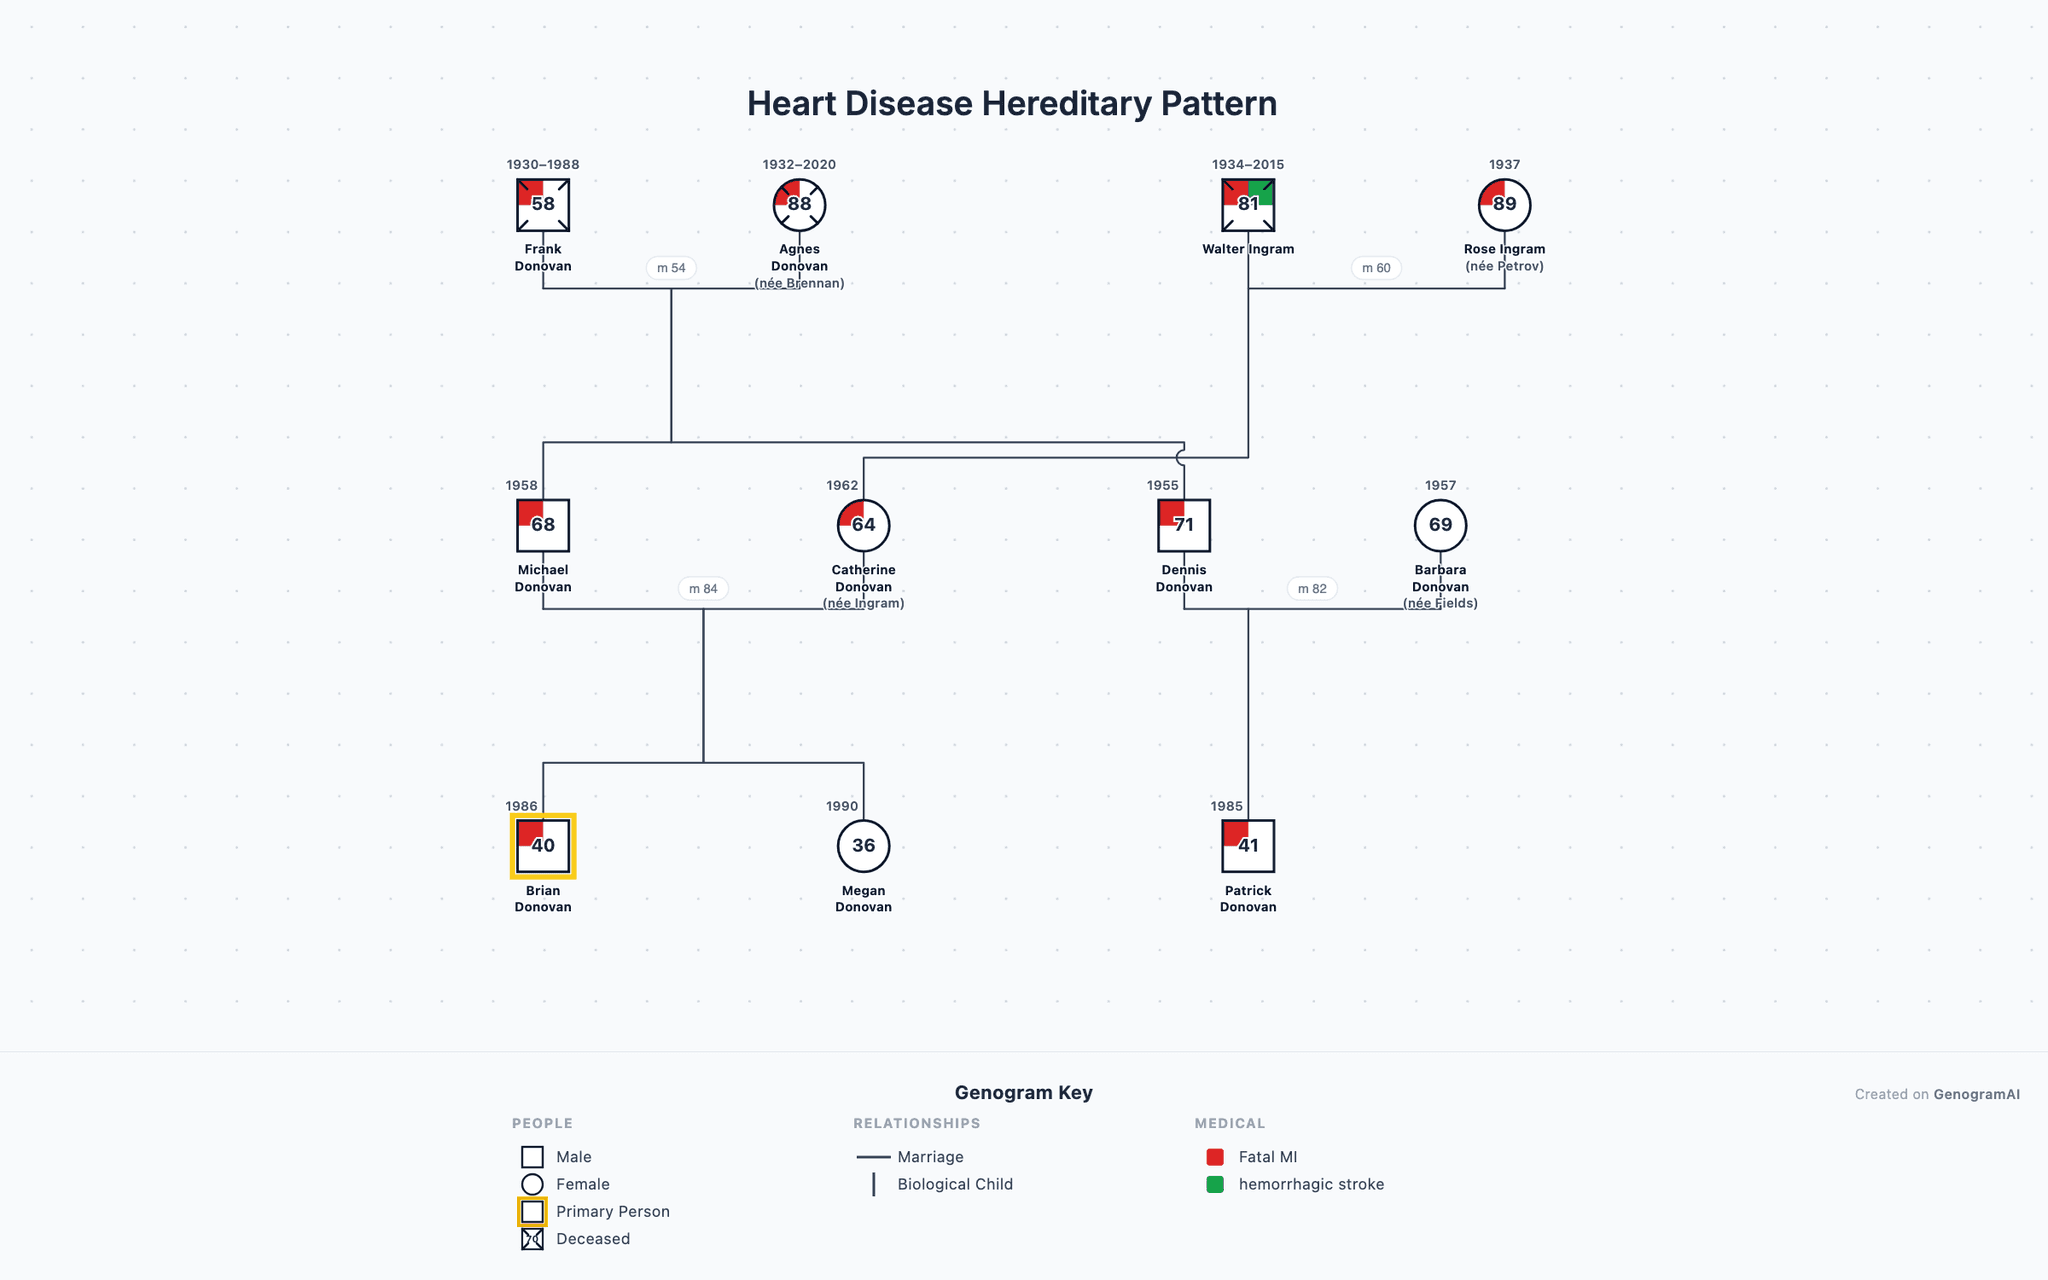
Heart Disease Hereditary Pattern
A three-generation genogram demonstrating the hereditary pattern of coronary artery disease and cardiovascular risk factors.
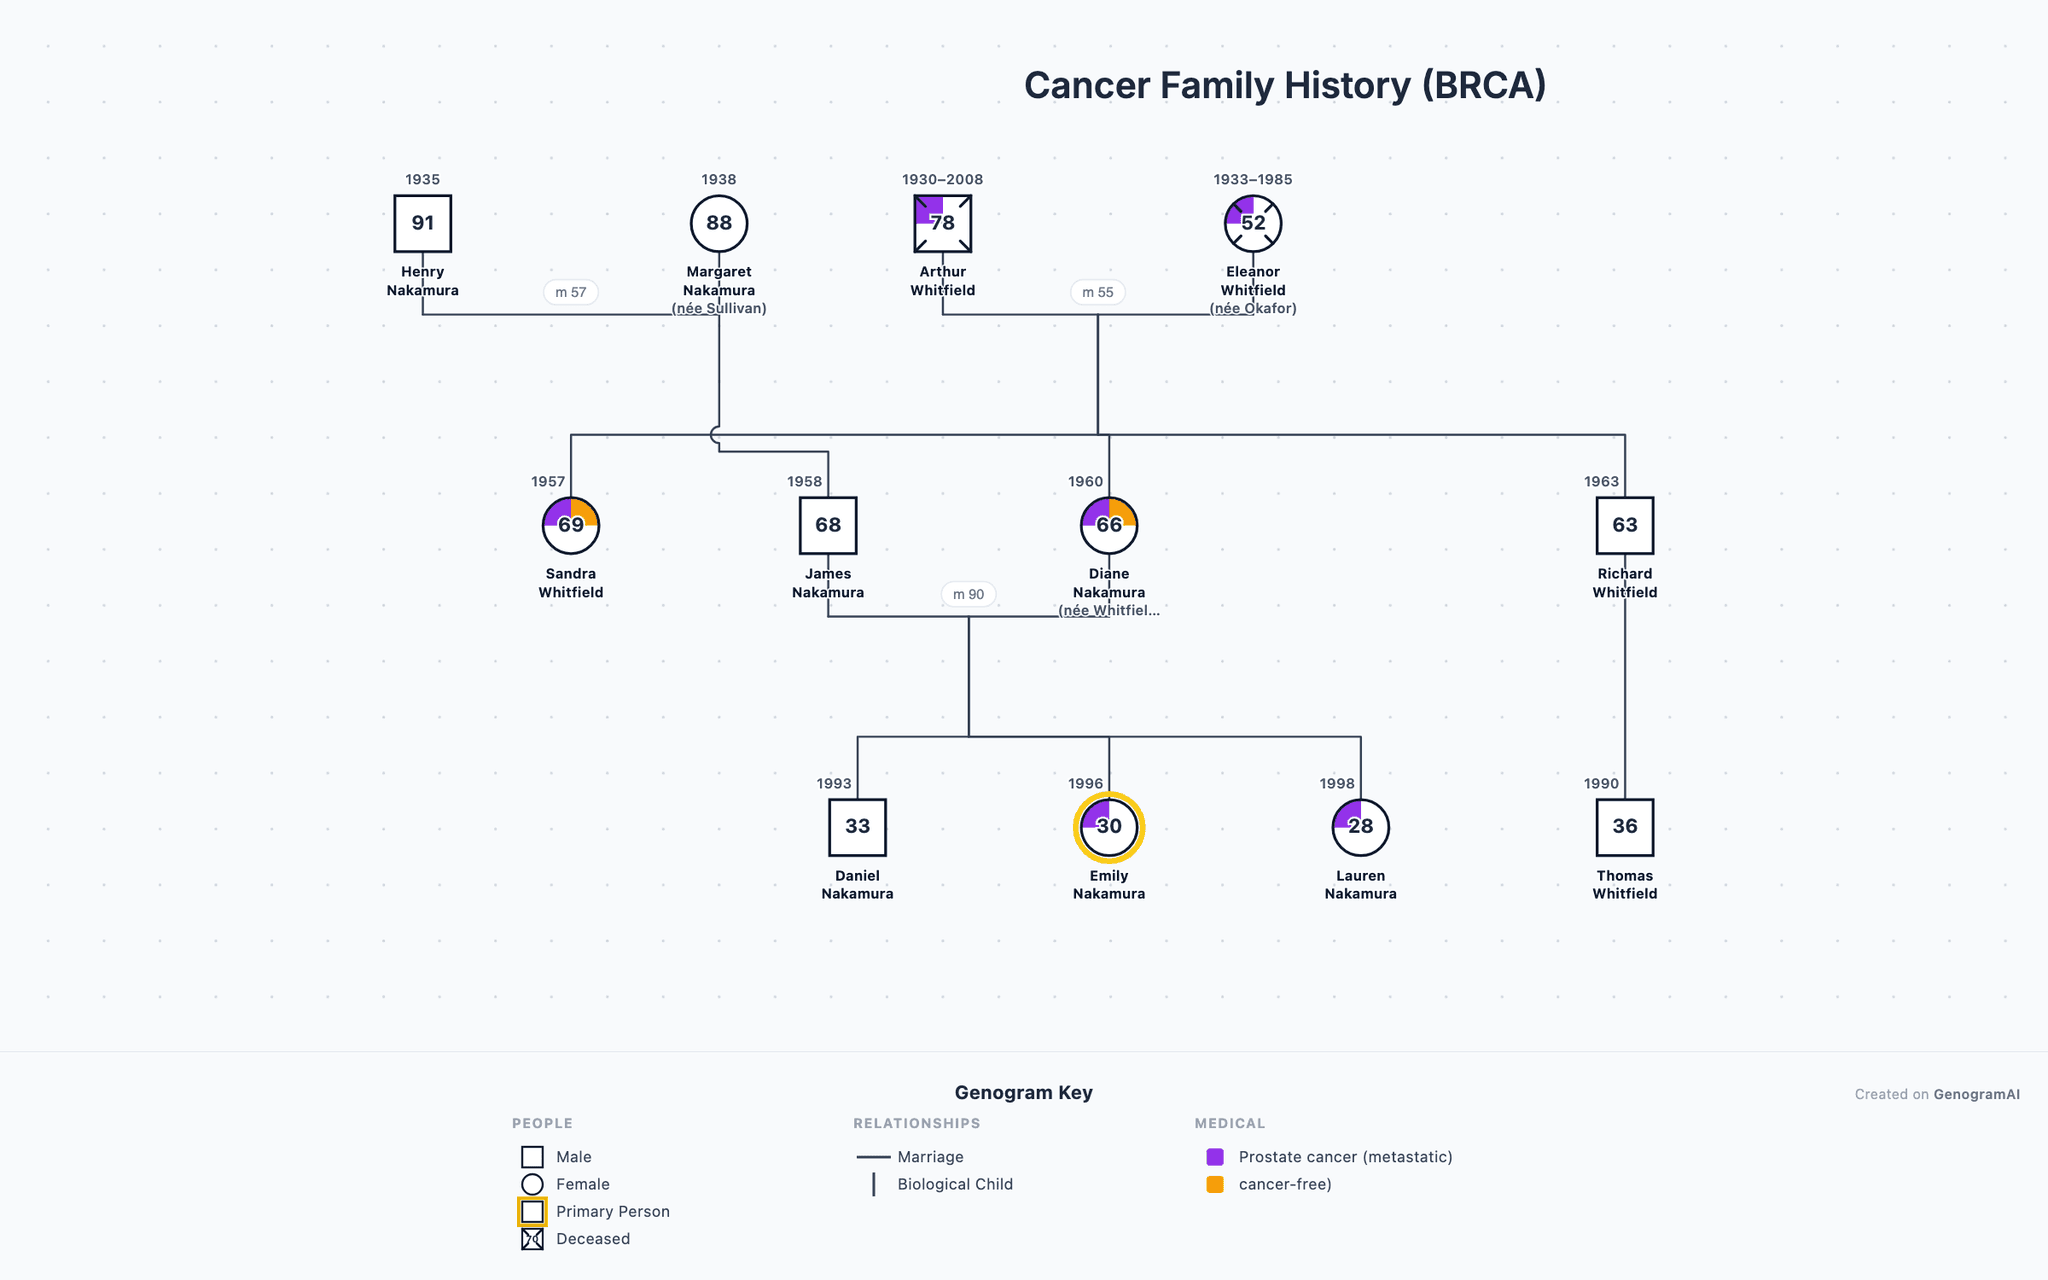
Cancer Family History (BRCA)
A three-generation genogram tracing a BRCA1 mutation through a maternal lineage. The maternal grandmother was diagnosed with breast cancer at 45 and died at 52.
Create Your Own Genogram
Use GenogramAI to build your own family genogram with AI assistance. Describe your family and let AI do the rest.
Educational disclaimer: This genogram example is an educational illustration of genogram notation and family systems concepts. Examples based on public figures use publicly available information. They are not clinical documents. All examples are intended for learning genogram symbols and patterns.