Genealogy Research Genogram with Sources and Evidence
Five-generation Irish-American genogram with approximate dates, census and parish sources and conflicting evidence, for genealogy research.
Interactive Genealogy Research Genogram with Sources and Evidence
Click and drag to explore. Zoom with scroll.
Can't see the genogram? View in the GenogramAI Gallery
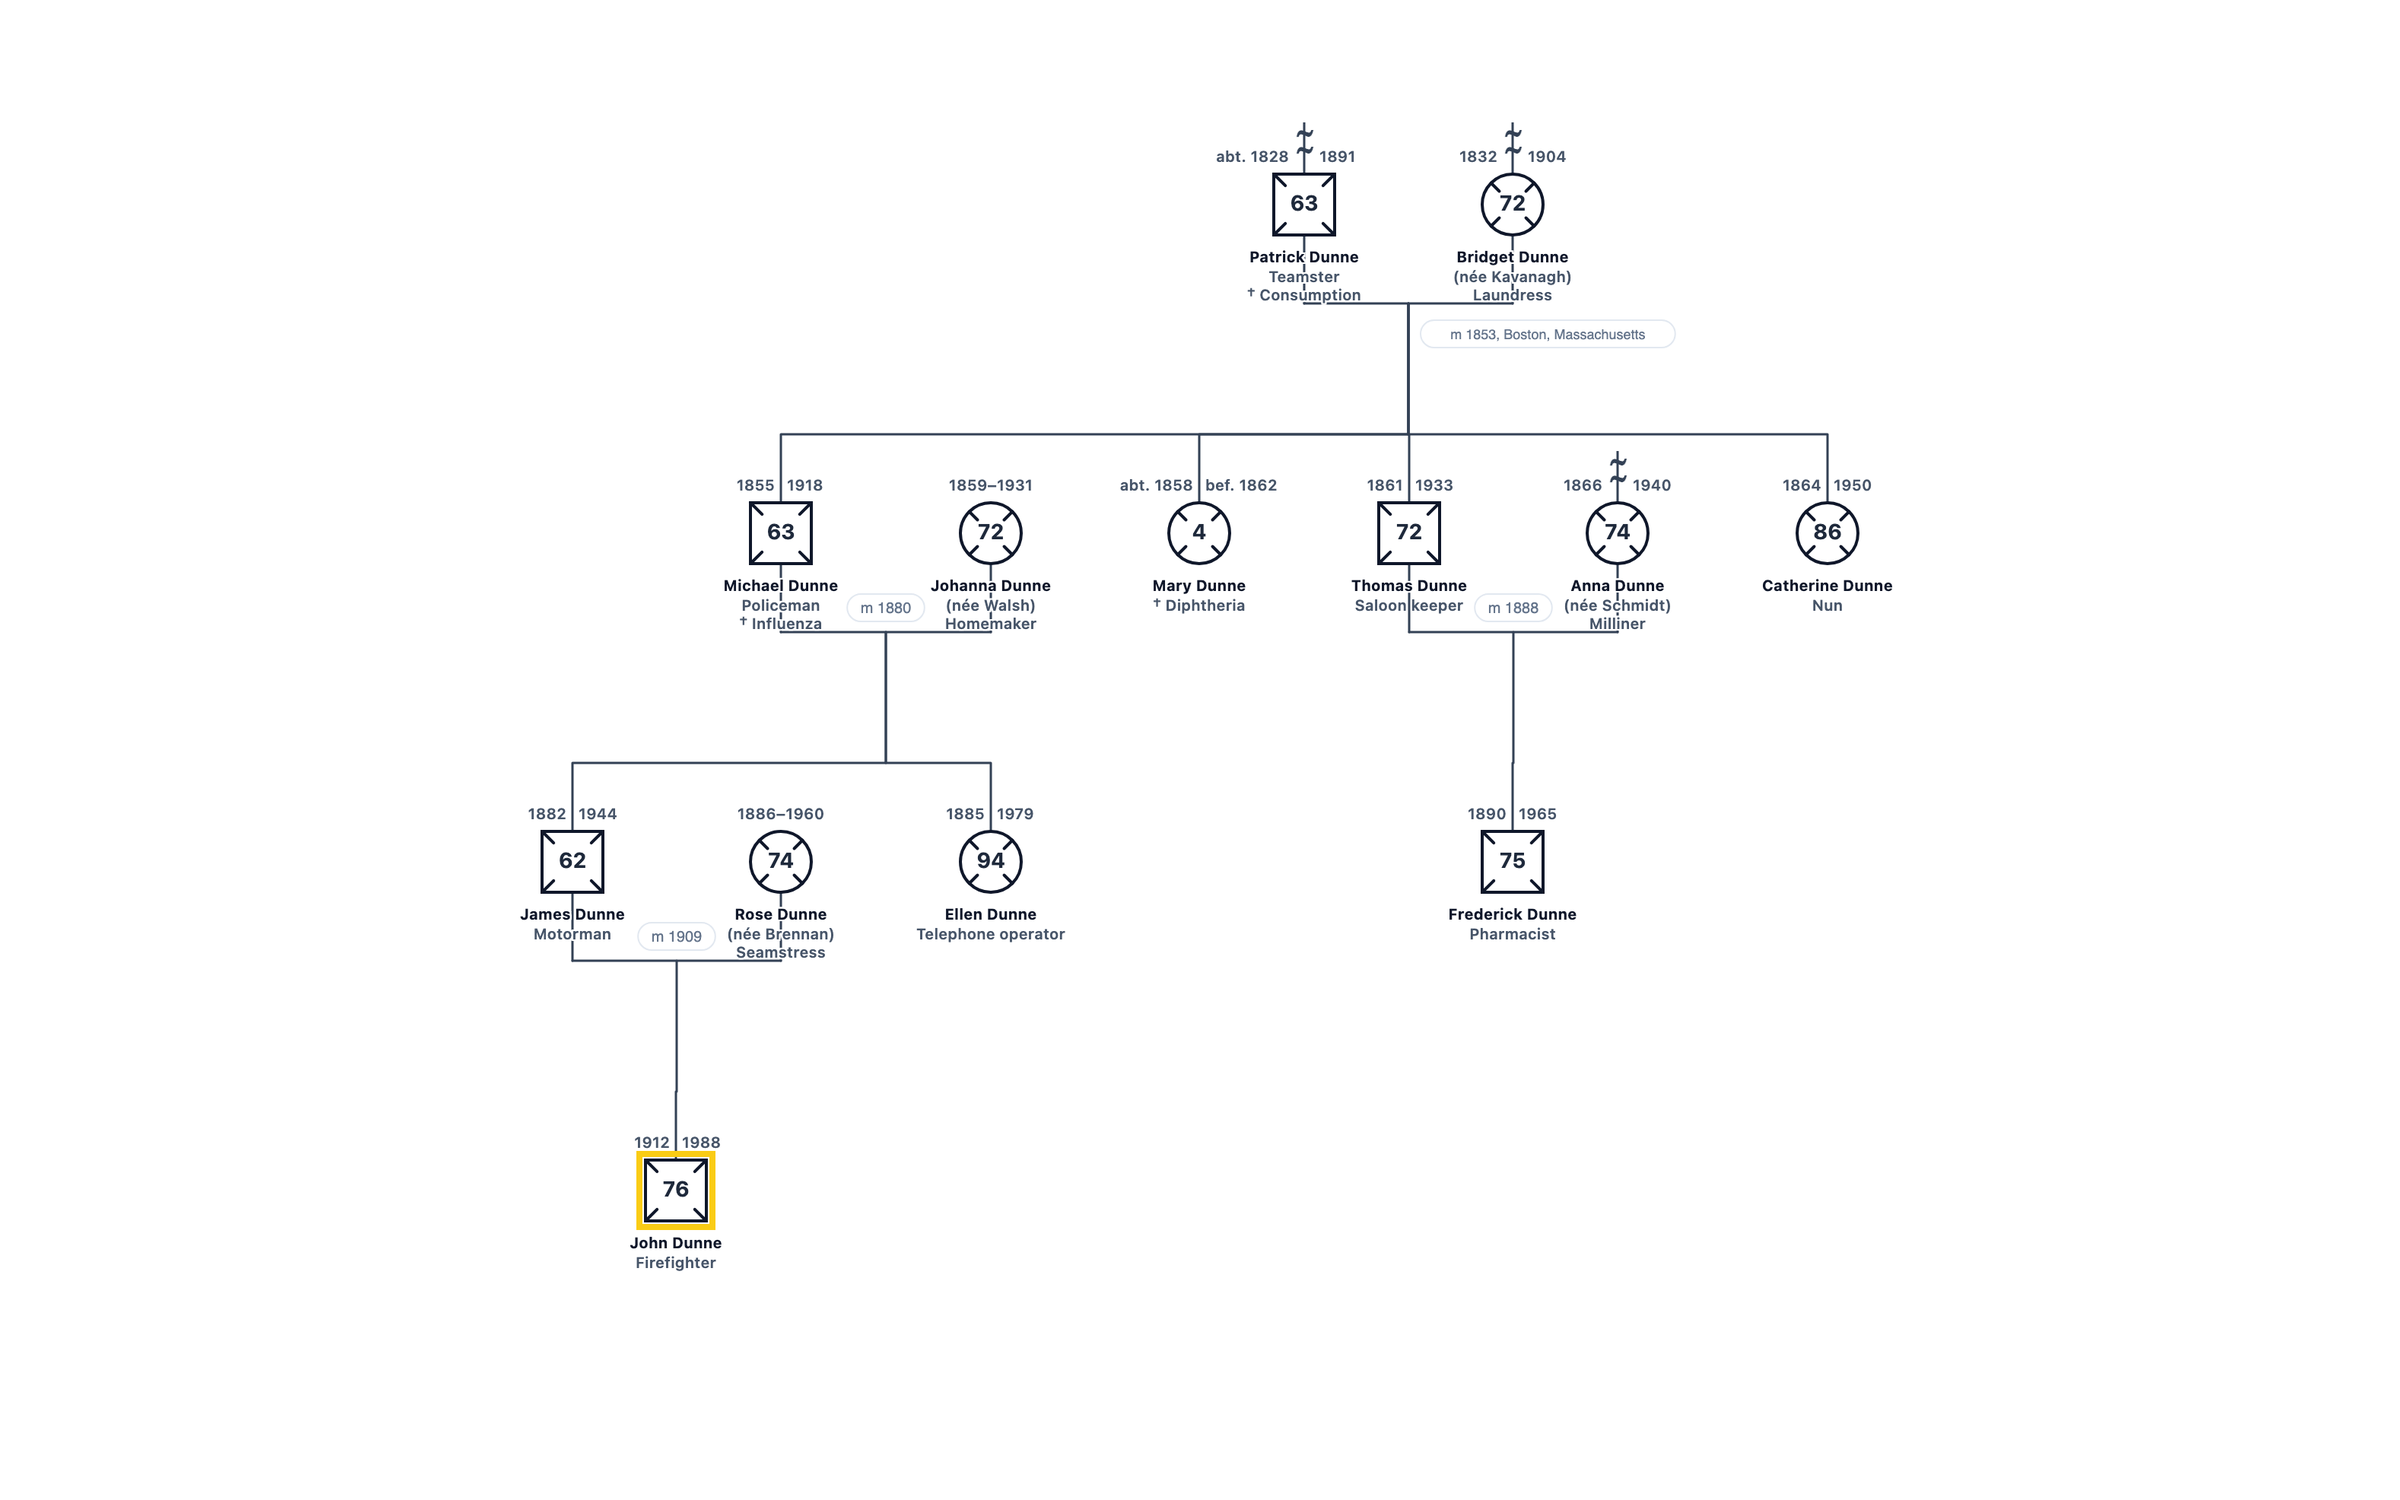
About This Genogram
A five-generation genogram of a fictional Irish-American family from the 1820s to the 1980s, built the way a genealogist works: approximate and bounded dates ("abt.", "bef."), famine-era emigration, a marriage place, and a source library of parish registers, censuses, a ship manifest and death records, with conflicting birth-year evidence recorded for Research view.
How to Read This Genogram
In MSW and MFT training programs, students construct and interpret genograms as a core competency because the skill underpins much of what happens in family-based assessment. Early assignments ask students to diagram their own family of origin using standard notation, which develops both technical accuracy and reflective self-awareness about the systems that shaped them. Later assignments introduce constructed case examples like this one, where students practice reading an unfamiliar family's structure, identifying generational patterns, and forming evidence-based hypotheses about how the family system might influence the presenting concern.
The skills built through repeated genogram work include tracking information across multiple generations simultaneously, translating verbal family history into a visual format that a supervisor or treatment team can read quickly, and distinguishing structural facts from relational inferences. Students also learn to update a genogram as new information emerges during treatment, treating it as a living clinical document rather than a one-time intake tool. Familiarity with these skills before entering field placements allows students to spend their clinical hours on assessment and intervention rather than on learning the notation system from scratch under supervision.
Key Patterns in This Genogram
Symbol Reference
Standard genogram symbols and notation demonstrated in context.
Template Structure
Proper genogram layout and organization for academic assignments.
Learning Framework
A teaching tool for understanding family systems theory in practice.
Pattern Analysis
Patrick Dunne was born about 1828 in Clonmel, Tipperary, left Ireland during the famine and reached Boston by 1850. He married Bridget Kavanagh there in 1853. The genogram follows their descendants through four generations, ending with their great-grandson John Dunne (1912–1988), a firefighter, as the index person.
Every fact is tied to a source in the chart’s library: a Clonmel parish register, the 1849 ship manifest, the 1860 and 1880 federal censuses, a cathedral marriage register, death records, a 1917 draft card, a 1918 obituary and a 2024 oral-history interview. Patrick’s birth year is a typical conflict: three records give three different years, and the chart records all three with the 1860 census chosen as the best evidence.
The chart also shows patterns that genealogists and family therapists both notice: a daughter, Mary, who died young of diphtheria; a son, Michael, lost in the 1918 influenza pandemic; a German-born daughter-in-law who joined an Irish Catholic family; and a daughter, Catherine, who became a nun. Copying the template carries the sources and evidence into your own Research view.
Build a Similar Genogram
A practitioner documenting a family similar to this one would typically record three generations of household composition, significant life events such as births, deaths, marriages, and separations, any relevant medical or mental health history, and the quality of key relationships between members. That information comes from a combination of the client's verbal account, intake questionnaires, and, where available, collateral records. The completed diagram captures both the factual structure of the family and the practitioner's clinical observations about relational patterns, making it a reference that can be shared across disciplines or reviewed at future stages of treatment.
GenogramAI's AI genogram generator allows you to build a diagram like this one from a plain-language description of the family. You type or paste a narrative, such as the basic structure and any key relationships or health history you want to include, and the AI parses that text, places the correct symbols, draws the appropriate relationship lines, and arranges the layout automatically. The result is a fully editable diagram that you can refine, annotate, and export for clinical records or educational use. Try the AI genogram creator to generate your own genogram from a text description in seconds.
Genogram Symbols Used in This Example
The following standard genogram symbols appear in the Genealogy Research Genogram with Sources and Evidence. Each symbol follows McGoldrick and Gerson clinical notation conventions.
Person Symbols
- Male (Square)
- A square represents a male family member.
- Female (Circle)
- A circle represents a female family member.
- Index person (highlighted outline)
- The person at the centre of the assessment is drawn with a highlighted outline.
- Deceased (X)
- An X through the symbol marks a person who has died; birth and death years are written above it.
- Age inside the symbol
- The current age (or age at death) is written inside each symbol, with years above it.
Dates and Evidence
- Approximate and qualified dates
- "abt." (about) and "bef." (before) in front of a year show a date that is estimated or bounded rather than recorded exactly.
Couples
- Marriage
- A solid line between partners; the marriage year is written on the line (m 90 = married 1990).
- Immigration marker
- A double wavy mark on a person’s line records immigration; a single wavy mark records living across two cultures.
Related Resources
- Read our guide to genograms for genealogists.
- Already have a tree? Try GEDCOM to genogram.
- Learn how Research view records sources and evidence.
- Patrick and Bridget’s emigration uses the immigration symbol.
Frequently Asked Questions
How is a genealogy genogram different from a family tree?
How are uncertain dates shown?
What happens when sources disagree?
Can I import my GEDCOM file?
Related Genogram Examples
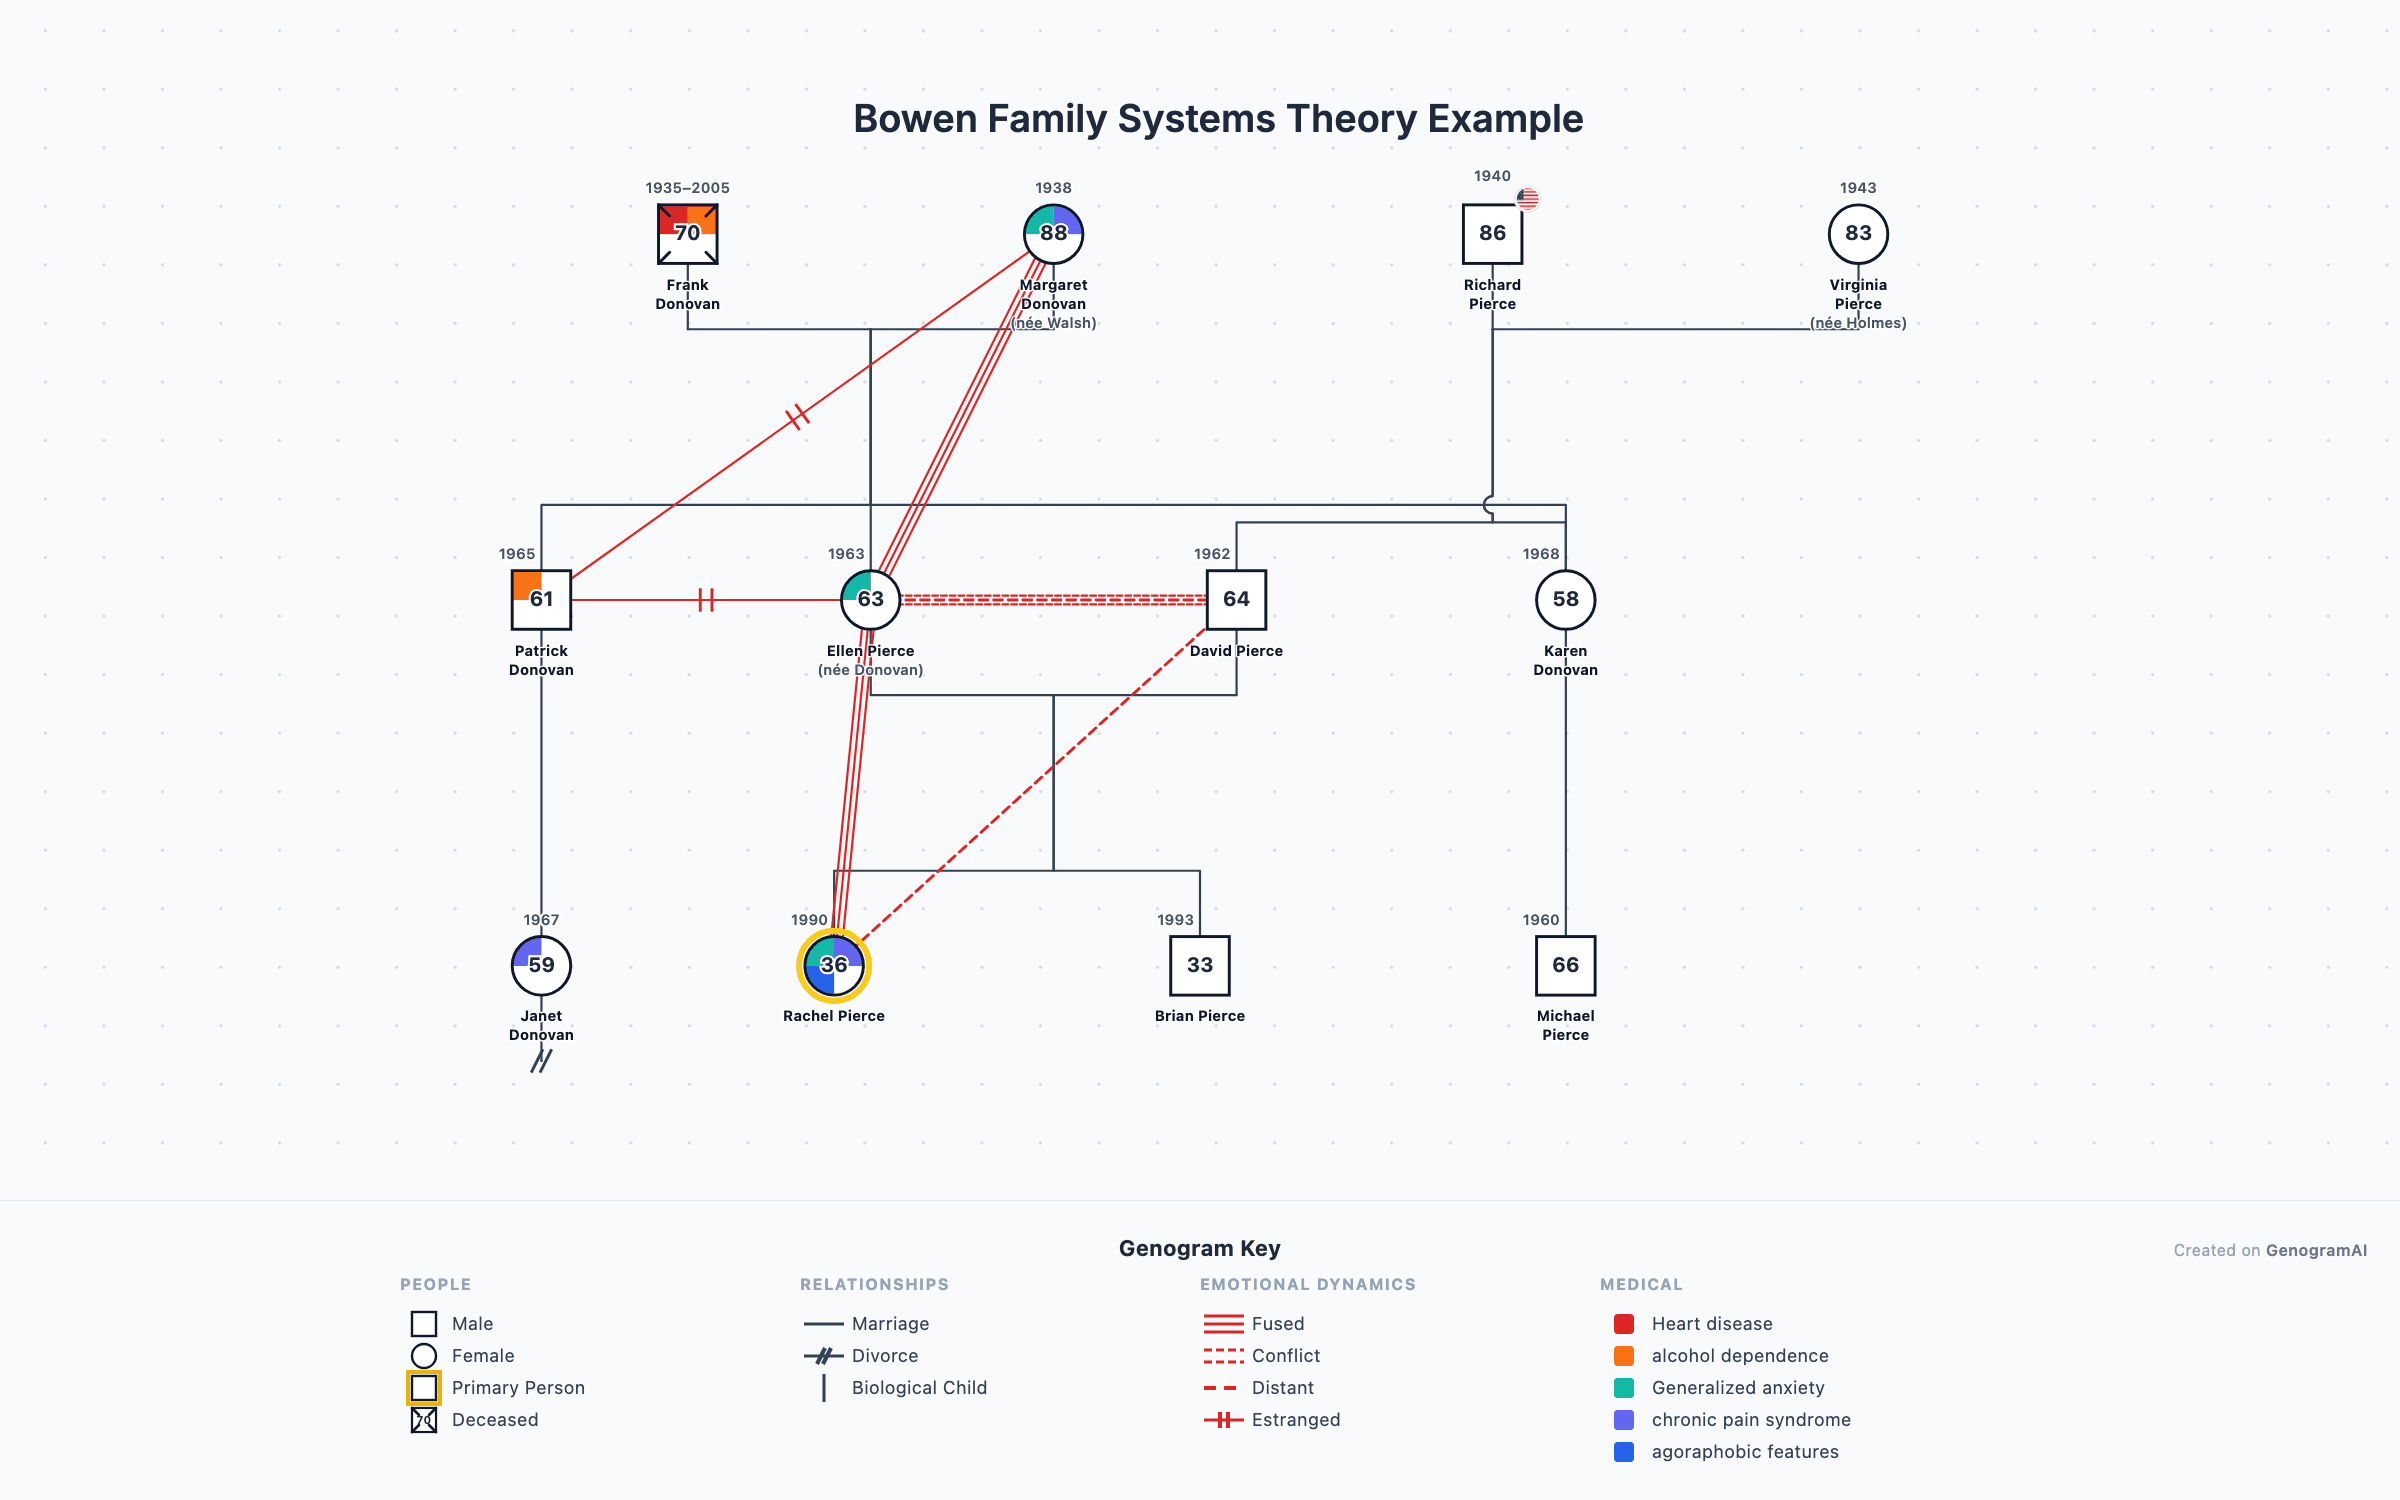
Bowen Family Systems Theory Example
A teaching genogram designed to illustrate Murray Bowen\'s eight interlocking concepts of family systems theory: differentiation of self, triangles.
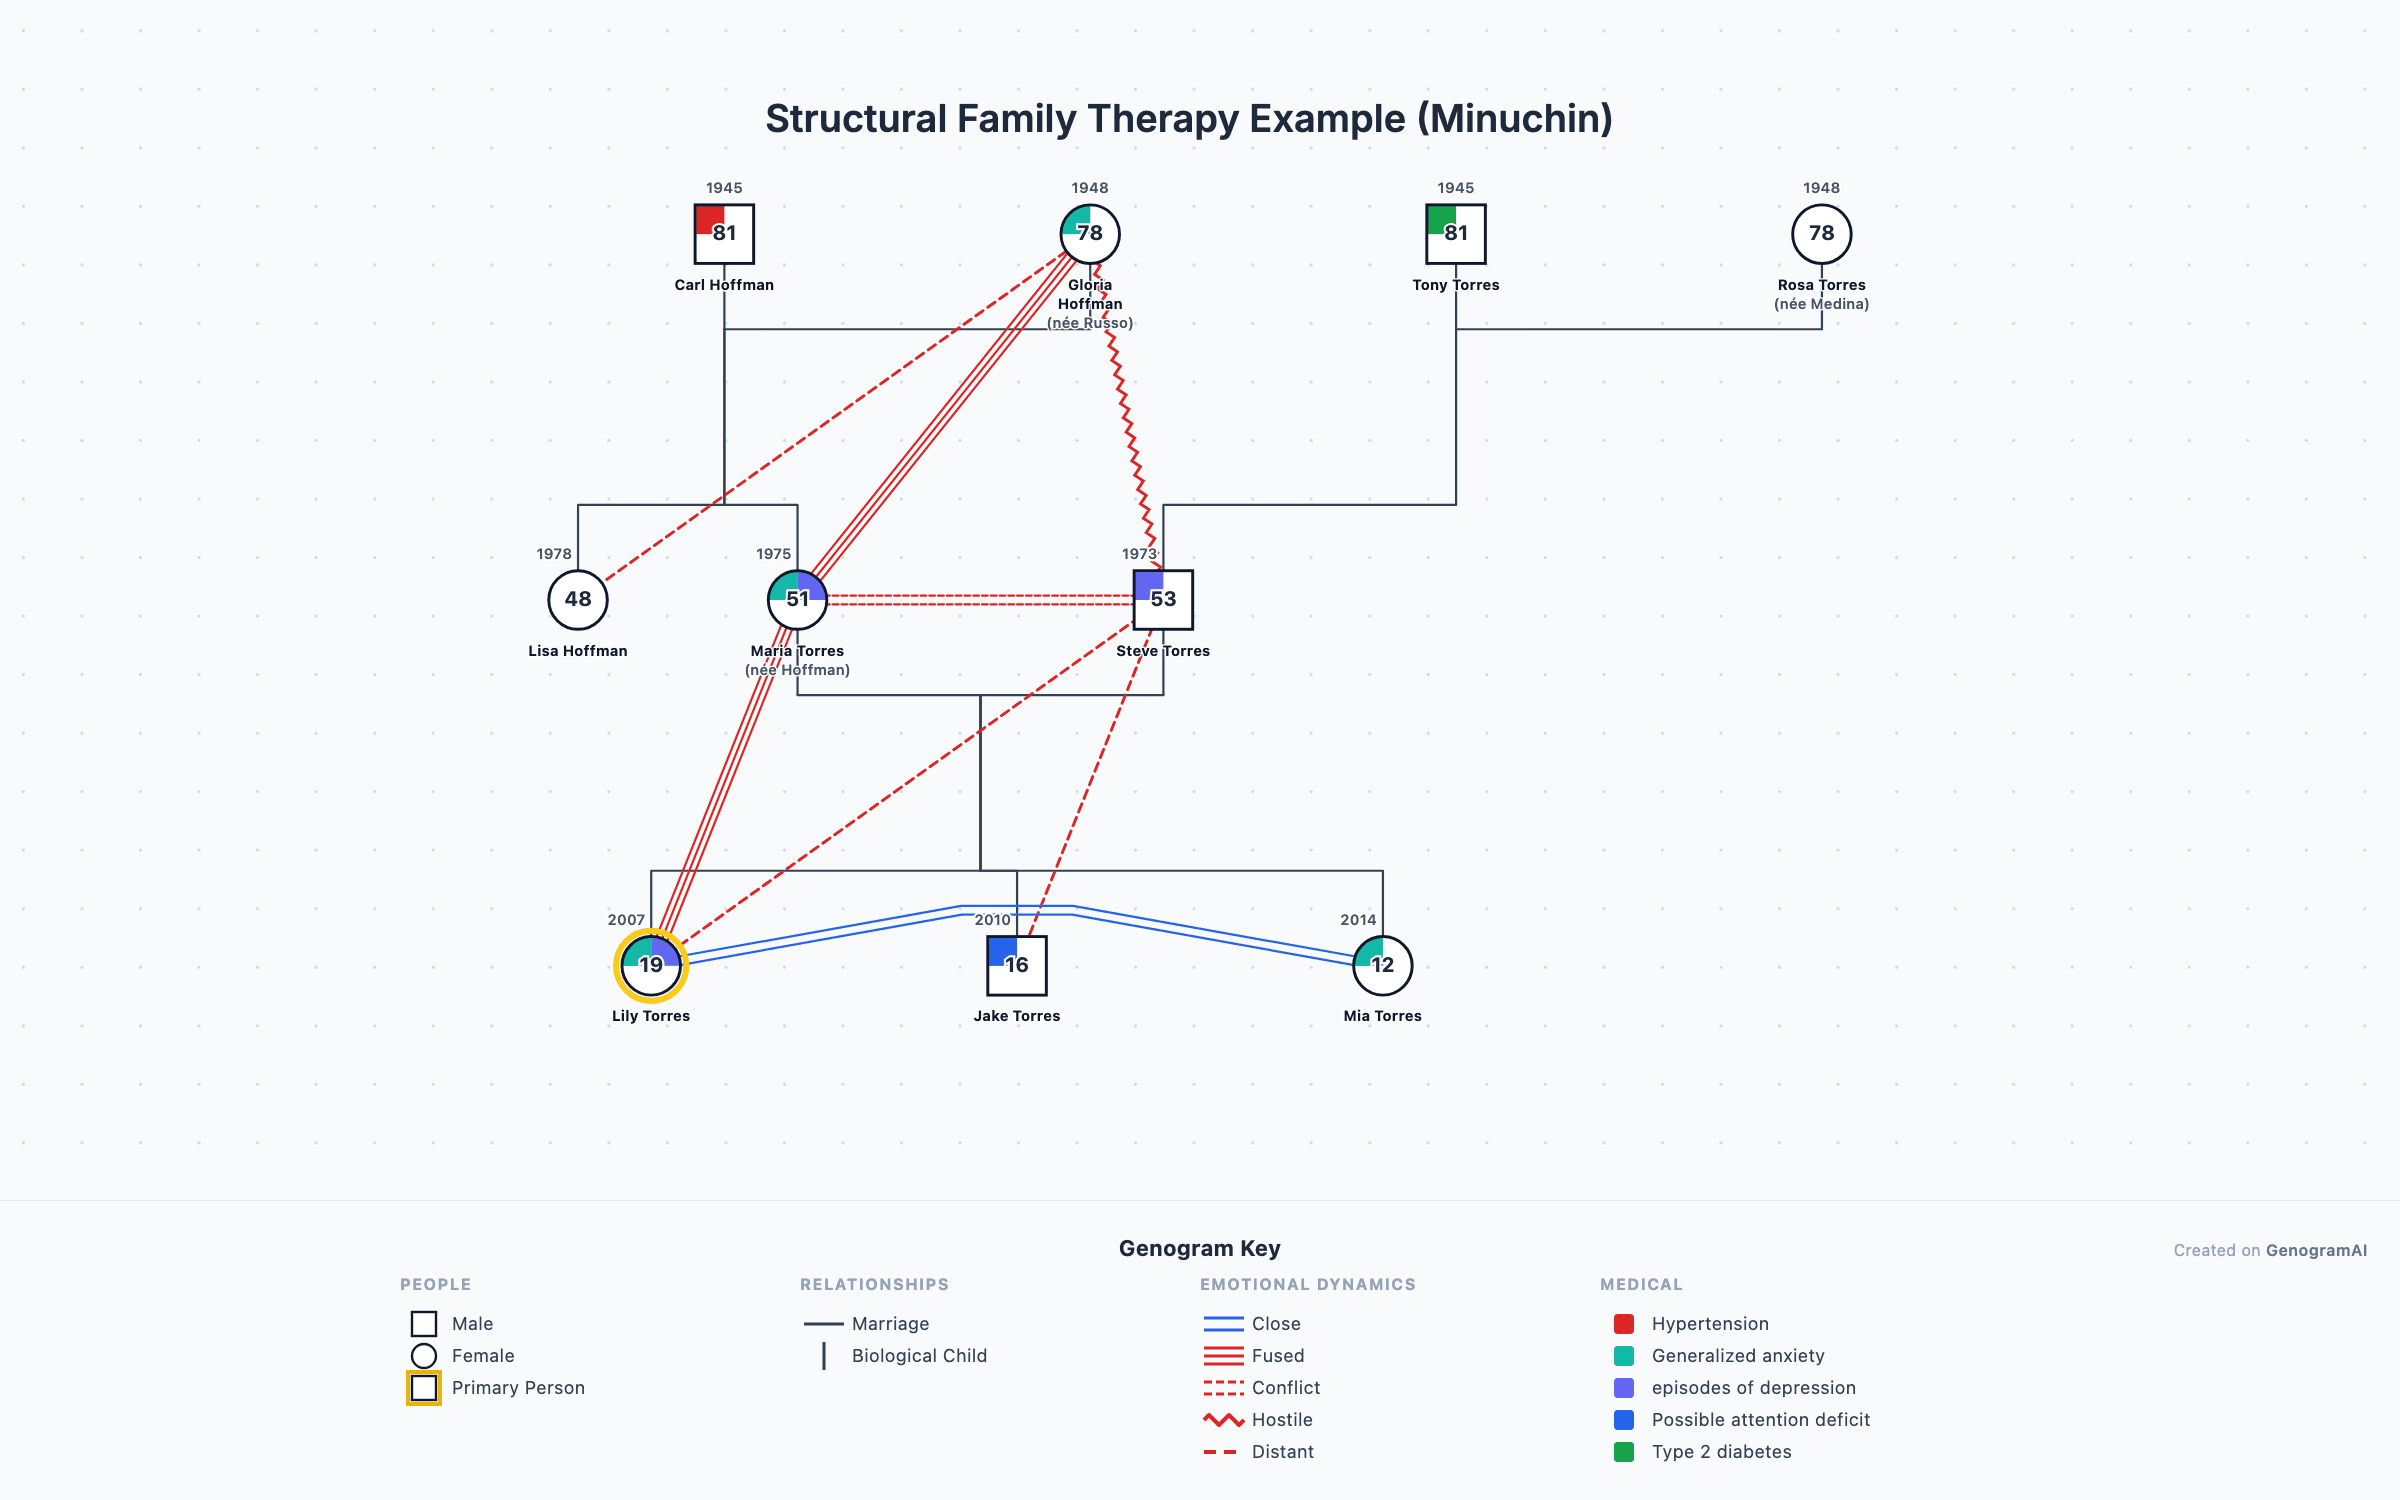
Structural Family Therapy Example (Minuchin)
A teaching genogram illustrating Salvador Minuchin\'s structural family therapy concepts: enmeshed and disengaged subsystems, cross-generational coalitions.
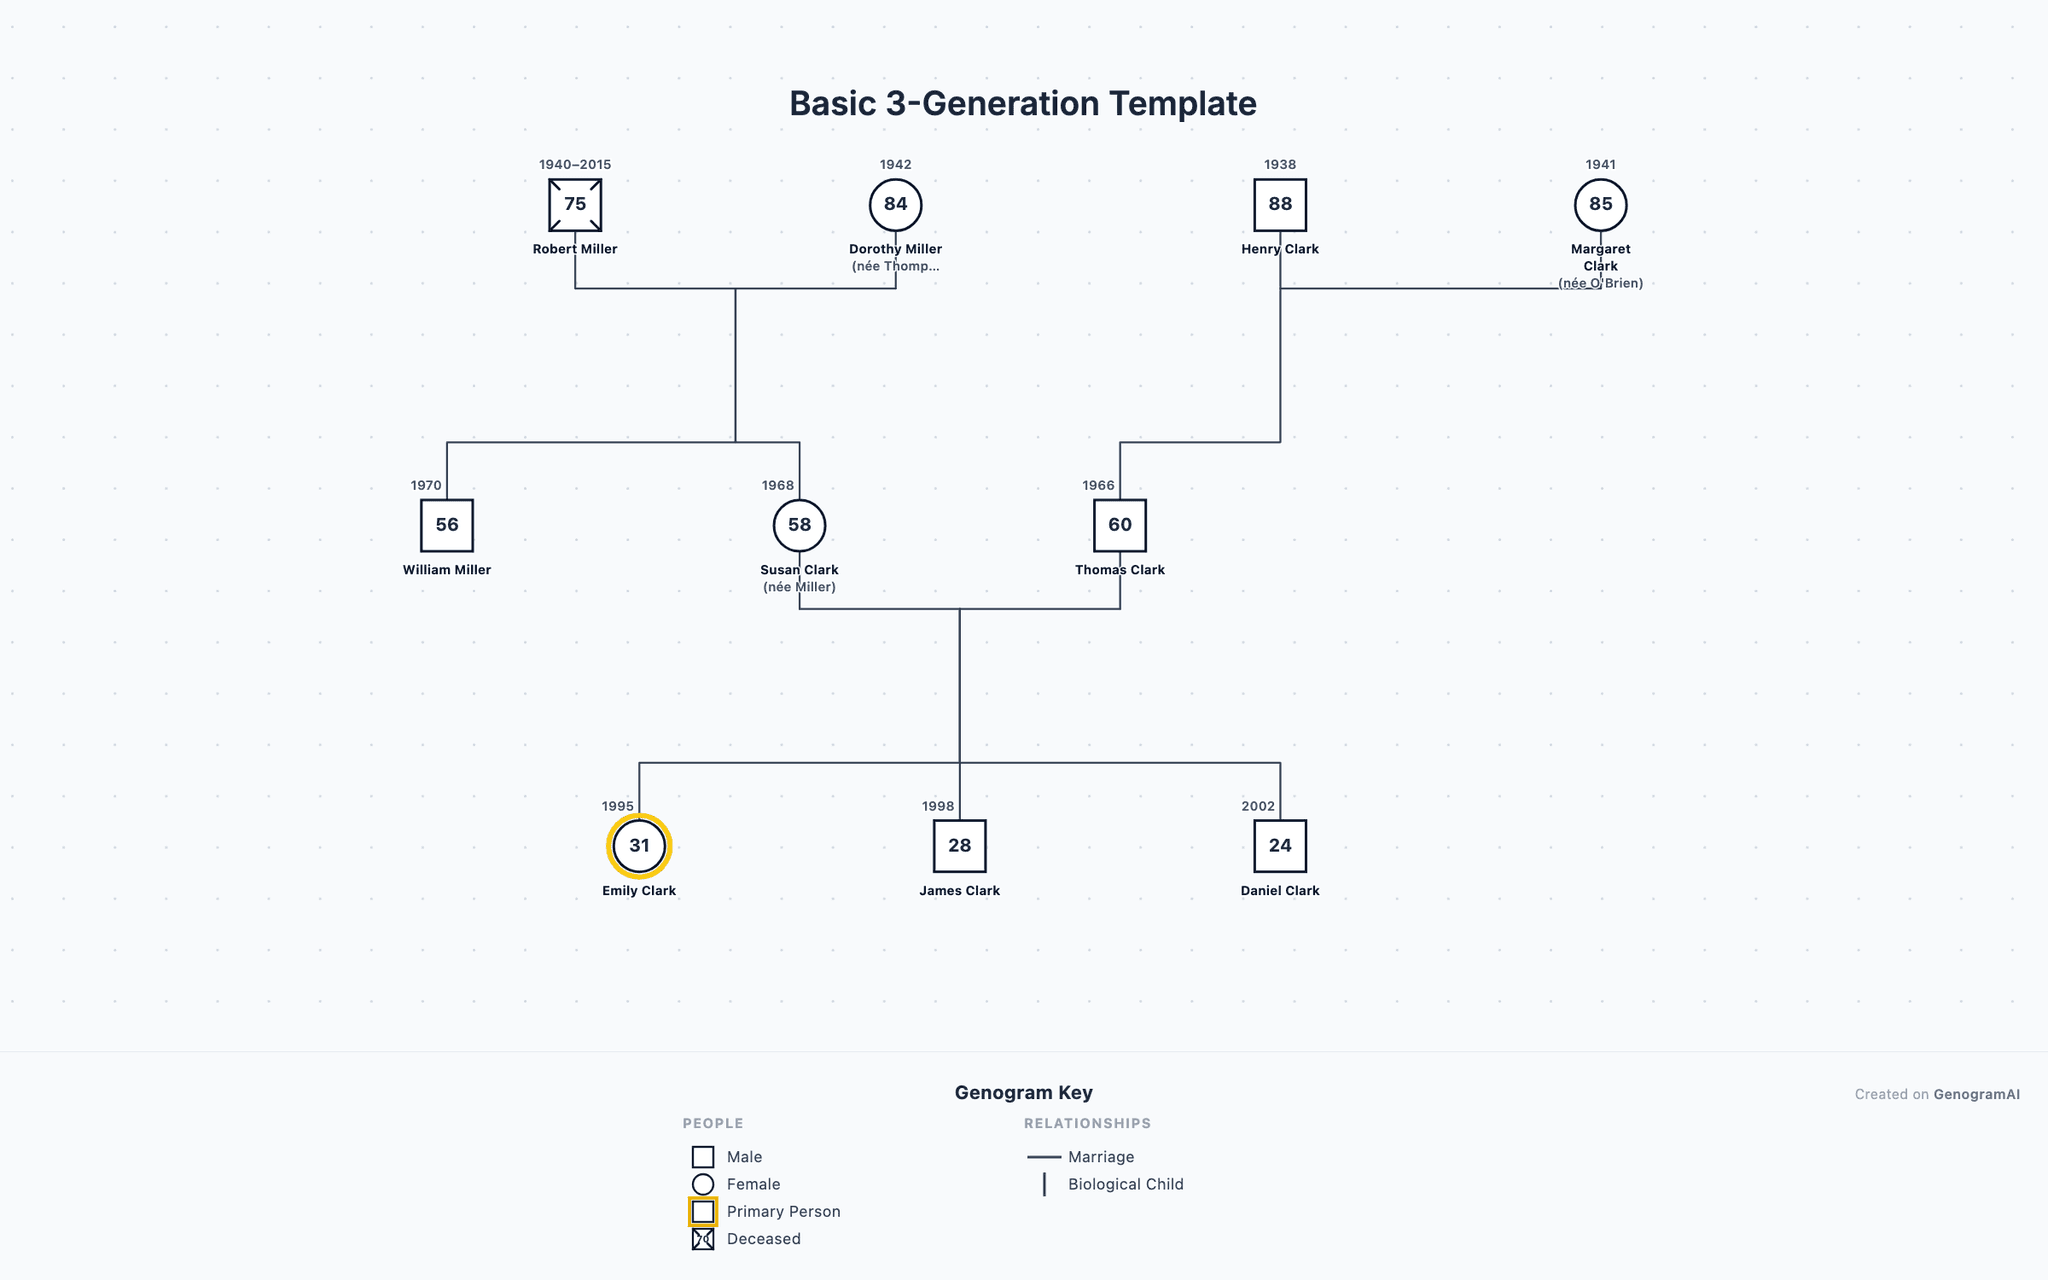
Basic 3-Generation Template
A clean, simple three-generation genogram template designed for teaching basic genogram construction.
Create Your Own Genogram
Use GenogramAI to build your own family genogram with AI assistance. Describe your family and let AI do the rest.
Educational disclaimer: This genogram example is an educational illustration of genogram notation and family systems concepts. Examples based on public figures use publicly available information. They are not clinical documents. All examples are intended for learning genogram symbols and patterns.