Later-Life Widowhood and Remarriage
Genogram of widowed parents who remarry late in life: adult step-children, inheritance triangle, caregiving and early dementia.
Interactive Later-Life Widowhood and Remarriage
Click and drag to explore. Zoom with scroll.
Can't see the genogram? View in the GenogramAI Gallery
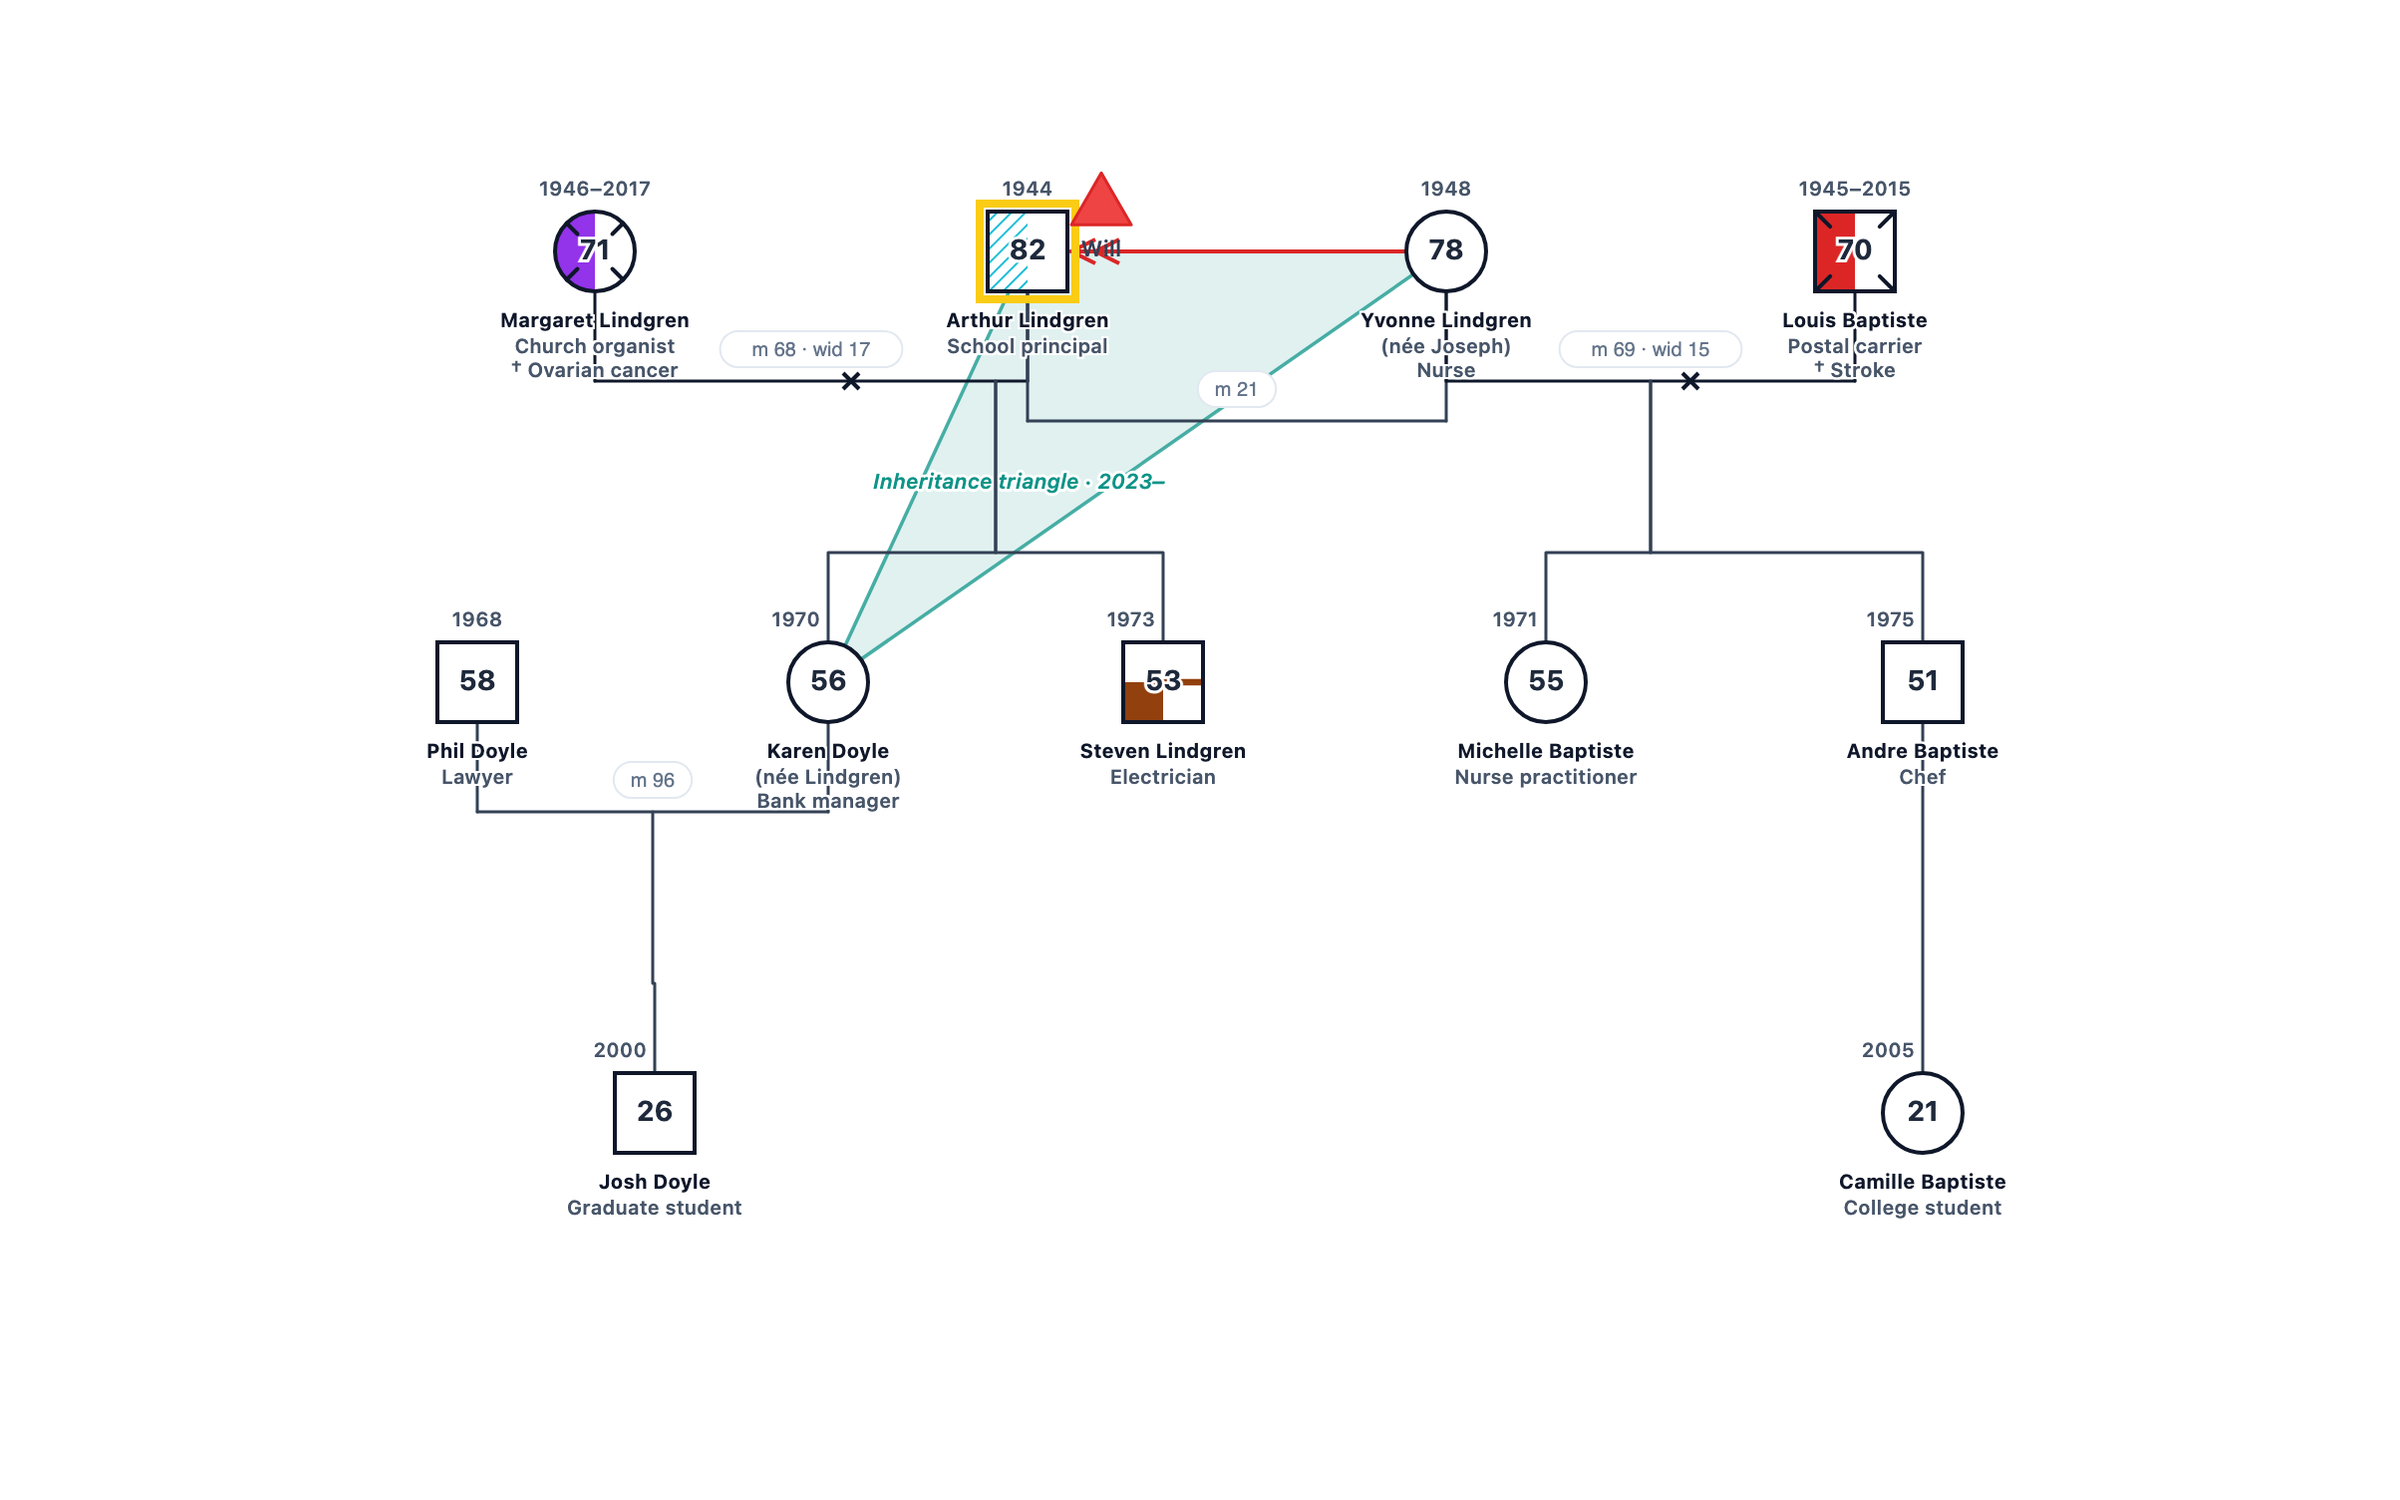
About This Genogram
A genogram of two fictional widowed parents who met in a grief group and remarried in their seventies. It shows both first marriages ending in widowhood, adult step-children on each side, an inheritance triangle, a changed will kept as a secret and early Alzheimer’s disease with the new wife as caregiver.
How to Read This Genogram
A family structure genogram maps household composition and biological or legal relationships across at least three generations using a standardized set of structural lines. Solid horizontal lines between two symbols indicate a committed partnership or marriage; a single diagonal slash through that line marks a separation, and a double slash marks a divorce. Children descend from the couple line on vertical drops, and their birth order runs left to right. Dashed lines or dotted horizontal connectors indicate step, foster, or adoptive bonds, so that a reader can distinguish biological parentage from the household arrangement in which a child was actually raised.
Reading a family structure genogram begins at the top generation and moves downward, noting who forms each household at each generational level. The key questions are: Which children grew up together? Which adults held parenting roles, and were those roles biological, legal, or both? Where do the generational boundaries fall? Households that contain members from more than one biological line, or that skip a generation, stand out visually and prompt the clinician to ask how those arrangements shaped each member's experience of family. Structure alone does not explain behavior, but it establishes the relational architecture on which emotional patterns are later mapped.
Key Patterns in This Genogram
Family Structure
How this family structure is represented using standard genogram notation.
Relationship Patterns
Key relationship dynamics and emotional bonds within the family system.
Clinical Application
How professionals use this type of genogram in assessment and treatment.
Family Analysis
Arthur Lindgren (82) was married to Margaret for 49 years until her death from ovarian cancer in 2017. Yvonne Lindgren (78), a retired nurse, lost her husband Louis to a stroke in 2015. They met in a grief support group in 2019 and married in 2021. Each brought two adult children into the new family.
The genogram shows how a late-life remarriage reorganises loyalties. Arthur’s daughter Karen, a bank manager, sees Yvonne as a threat to her mother’s memory and to the family home. In 2023 Arthur changed his will to let Yvonne stay in the house for her lifetime, a decision kept from his children and attached to his symbol as a secret. The inheritance triangle among Karen, Arthur and Yvonne dates from that year.
In 2025 Arthur was referred to a memory clinic, and Yvonne has become his main caregiver. Clinicians working with the family can use the chart to plan decisions about care and finances before Arthur’s capacity declines, and to give Yvonne’s own children, Michelle and Andre, a place in that conversation.
Build a Similar Genogram
A practitioner documenting a family similar to this one would typically record three generations of household composition, significant life events such as births, deaths, marriages, and separations, any relevant medical or mental health history, and the quality of key relationships between members. That information comes from a combination of the client's verbal account, intake questionnaires, and, where available, collateral records. The completed diagram captures both the factual structure of the family and the practitioner's clinical observations about relational patterns, making it a reference that can be shared across disciplines or reviewed at future stages of treatment.
GenogramAI's AI genogram generator allows you to build a diagram like this one from a plain-language description of the family. You type or paste a narrative, such as the basic structure and any key relationships or health history you want to include, and the AI parses that text, places the correct symbols, draws the appropriate relationship lines, and arranges the layout automatically. The result is a fully editable diagram that you can refine, annotate, and export for clinical records or educational use. Try the AI genogram creator to generate your own genogram from a text description in seconds.
Genogram Symbols Used in This Example
The following standard genogram symbols appear in the Later-Life Widowhood and Remarriage. Each symbol follows McGoldrick and Gerson clinical notation conventions.
Person Symbols
- Male (Square)
- A square represents a male family member.
- Female (Circle)
- A circle represents a female family member.
- Index person (highlighted outline)
- The person at the centre of the assessment is drawn with a highlighted outline.
- Deceased (X)
- An X through the symbol marks a person who has died; birth and death years are written above it.
- Age inside the symbol
- The current age (or age at death) is written inside each symbol, with years above it.
Couples
- Marriage
- A solid line between partners; the marriage year is written on the line (m 90 = married 1990).
- Widowed
- A small x on the couple line marks the end of a marriage through death (wid 15).
Family Process
- Emotional triangle
- A shaded triangle joining three people, labelled with its years, marks a triangle in the family system.
- Caretaking
- An arrow from the caregiver to the person cared for marks a caretaking role.
- Family secret
- A red marker beside a person holds a secret that is revealed on click.
Medical
- Medical shading
- The left half of a symbol is shaded for a physical or mental illness and the bottom half for alcohol or drug use; each condition has its own colour, listed in the key. Hatching means suspected, a partial fill means in recovery.
Related Resources
- Read about genograms in elderly care.
- For a younger blended family, see our blended step-family genogram.
- Both first spouses are drawn with the deceased symbol.
- See how genograms in grief counseling help widowed clients.
Frequently Asked Questions
How is widowhood shown on a genogram?
How are multiple marriages arranged?
What is the inheritance triangle in this example?
Why is dementia marked as suspected?
Related Genogram Examples
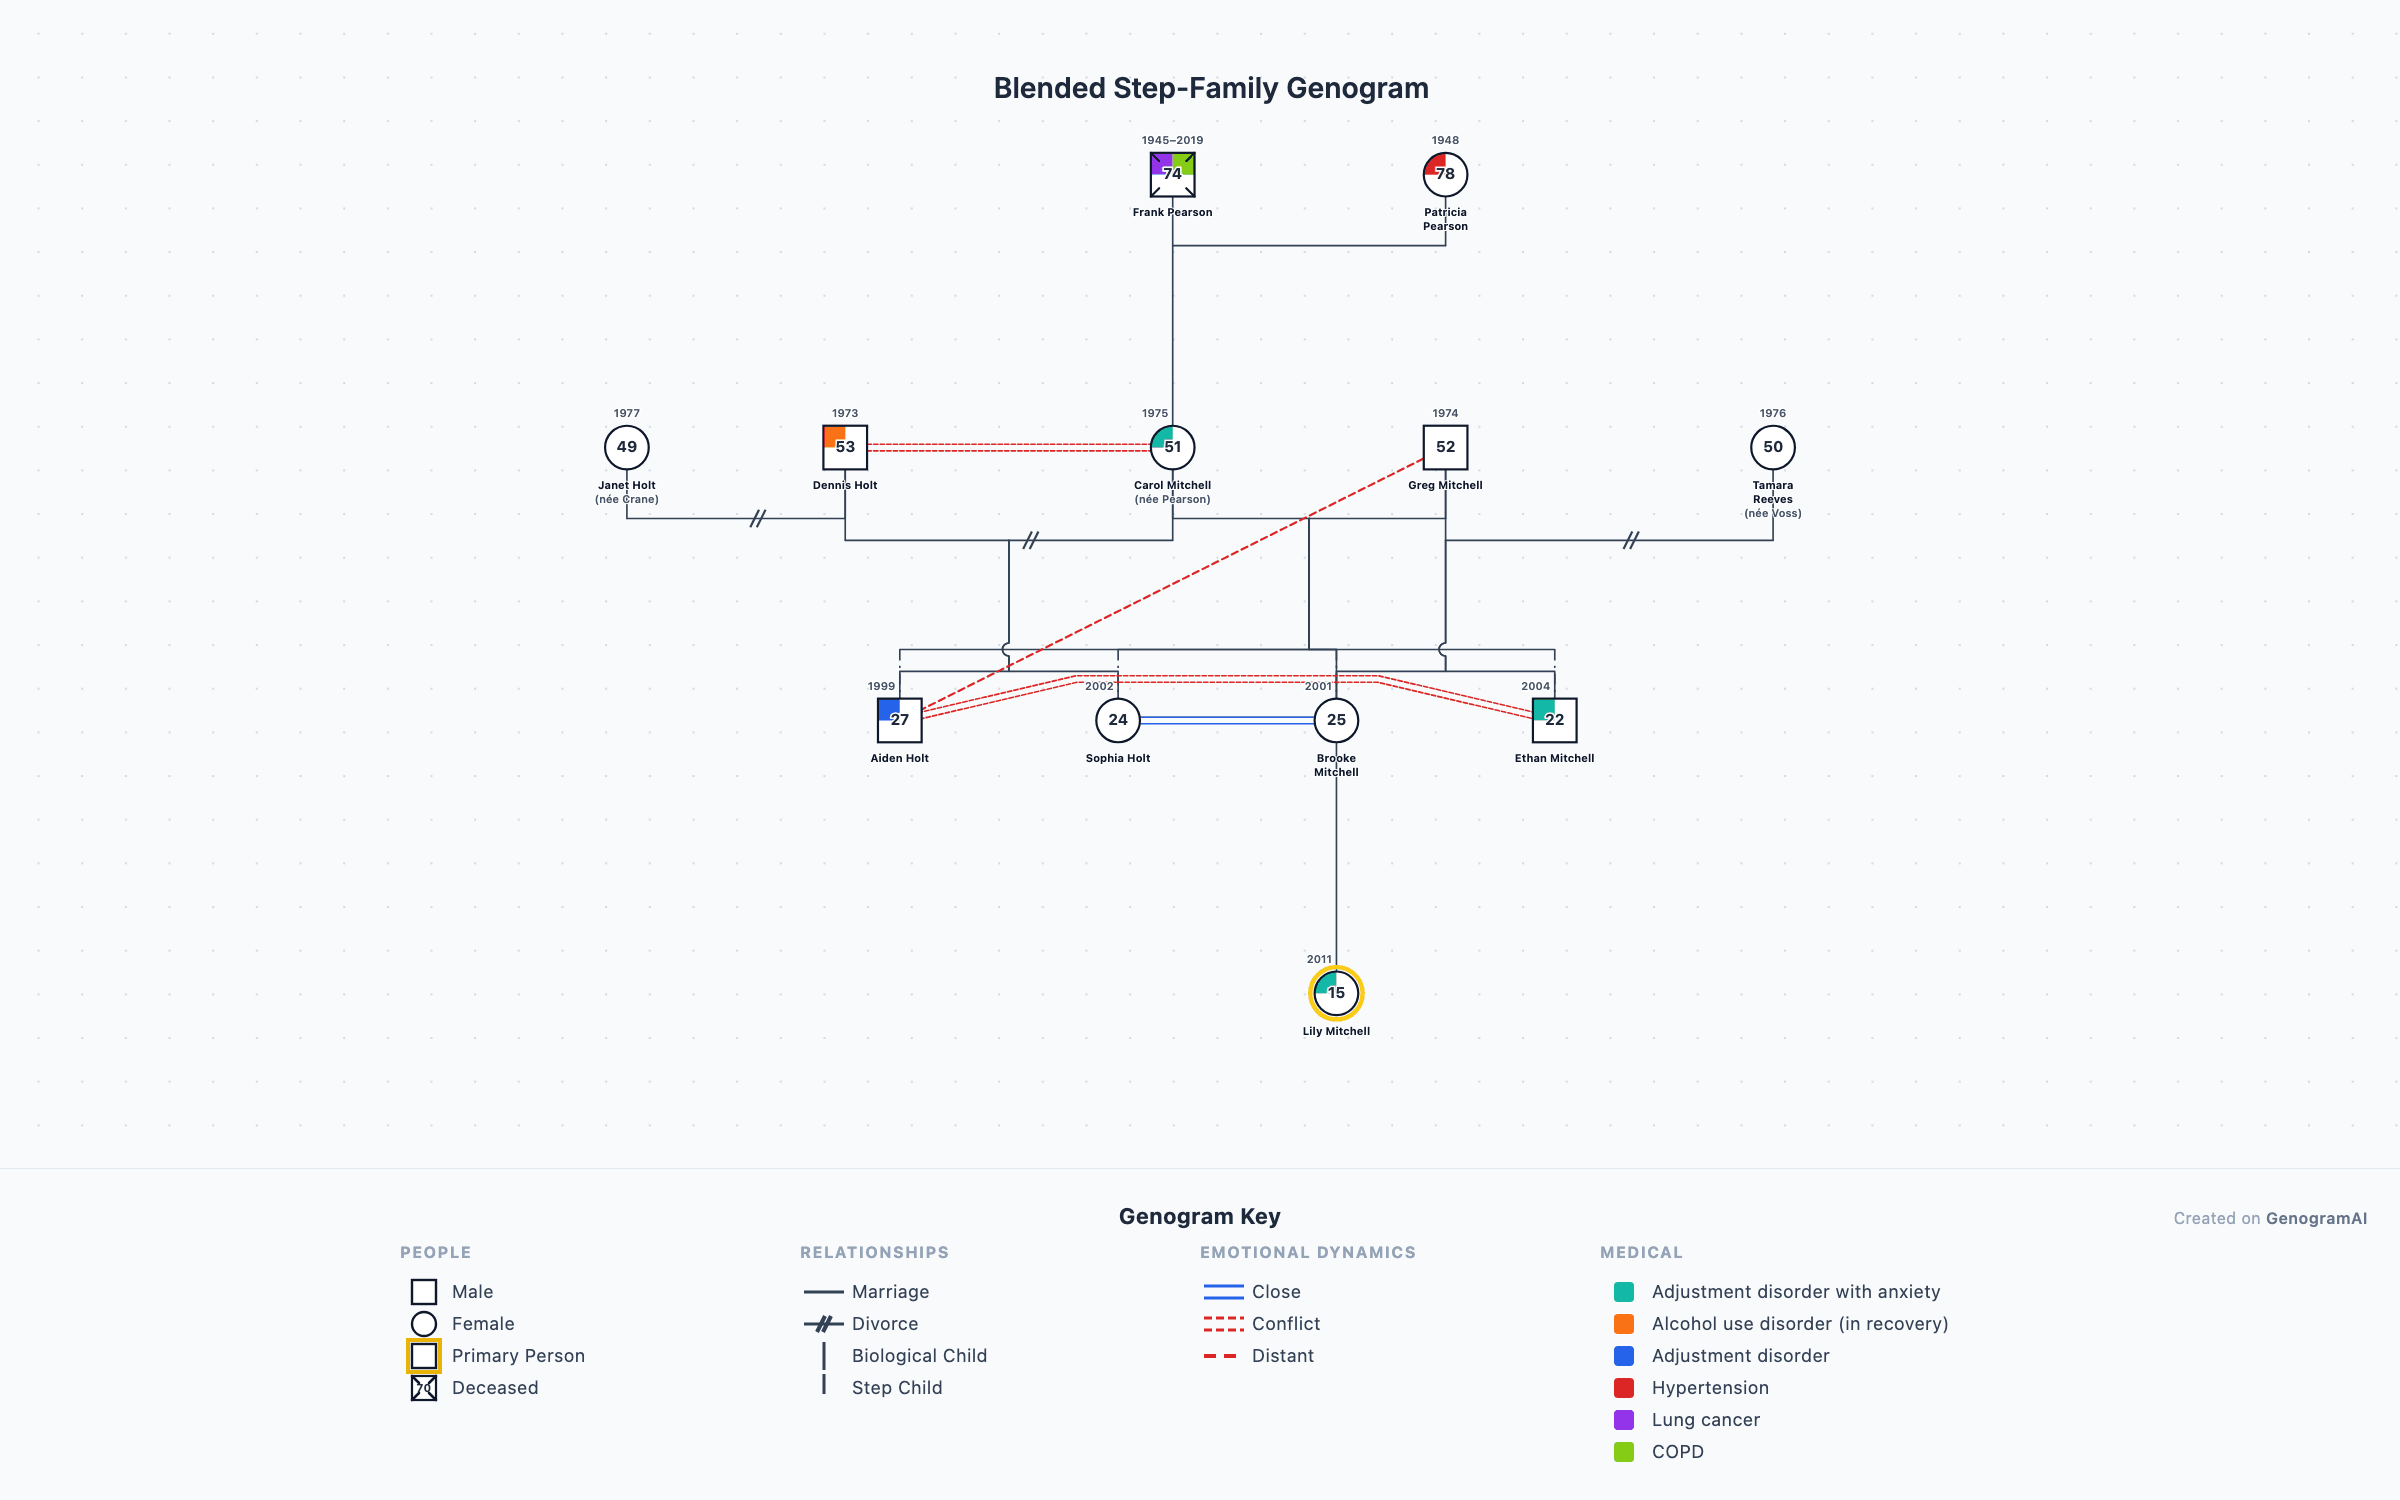
Blended Step-Family Genogram
A complex blended step-family genogram showing two divorced parents who remarried each other, each bringing children from prior marriages.
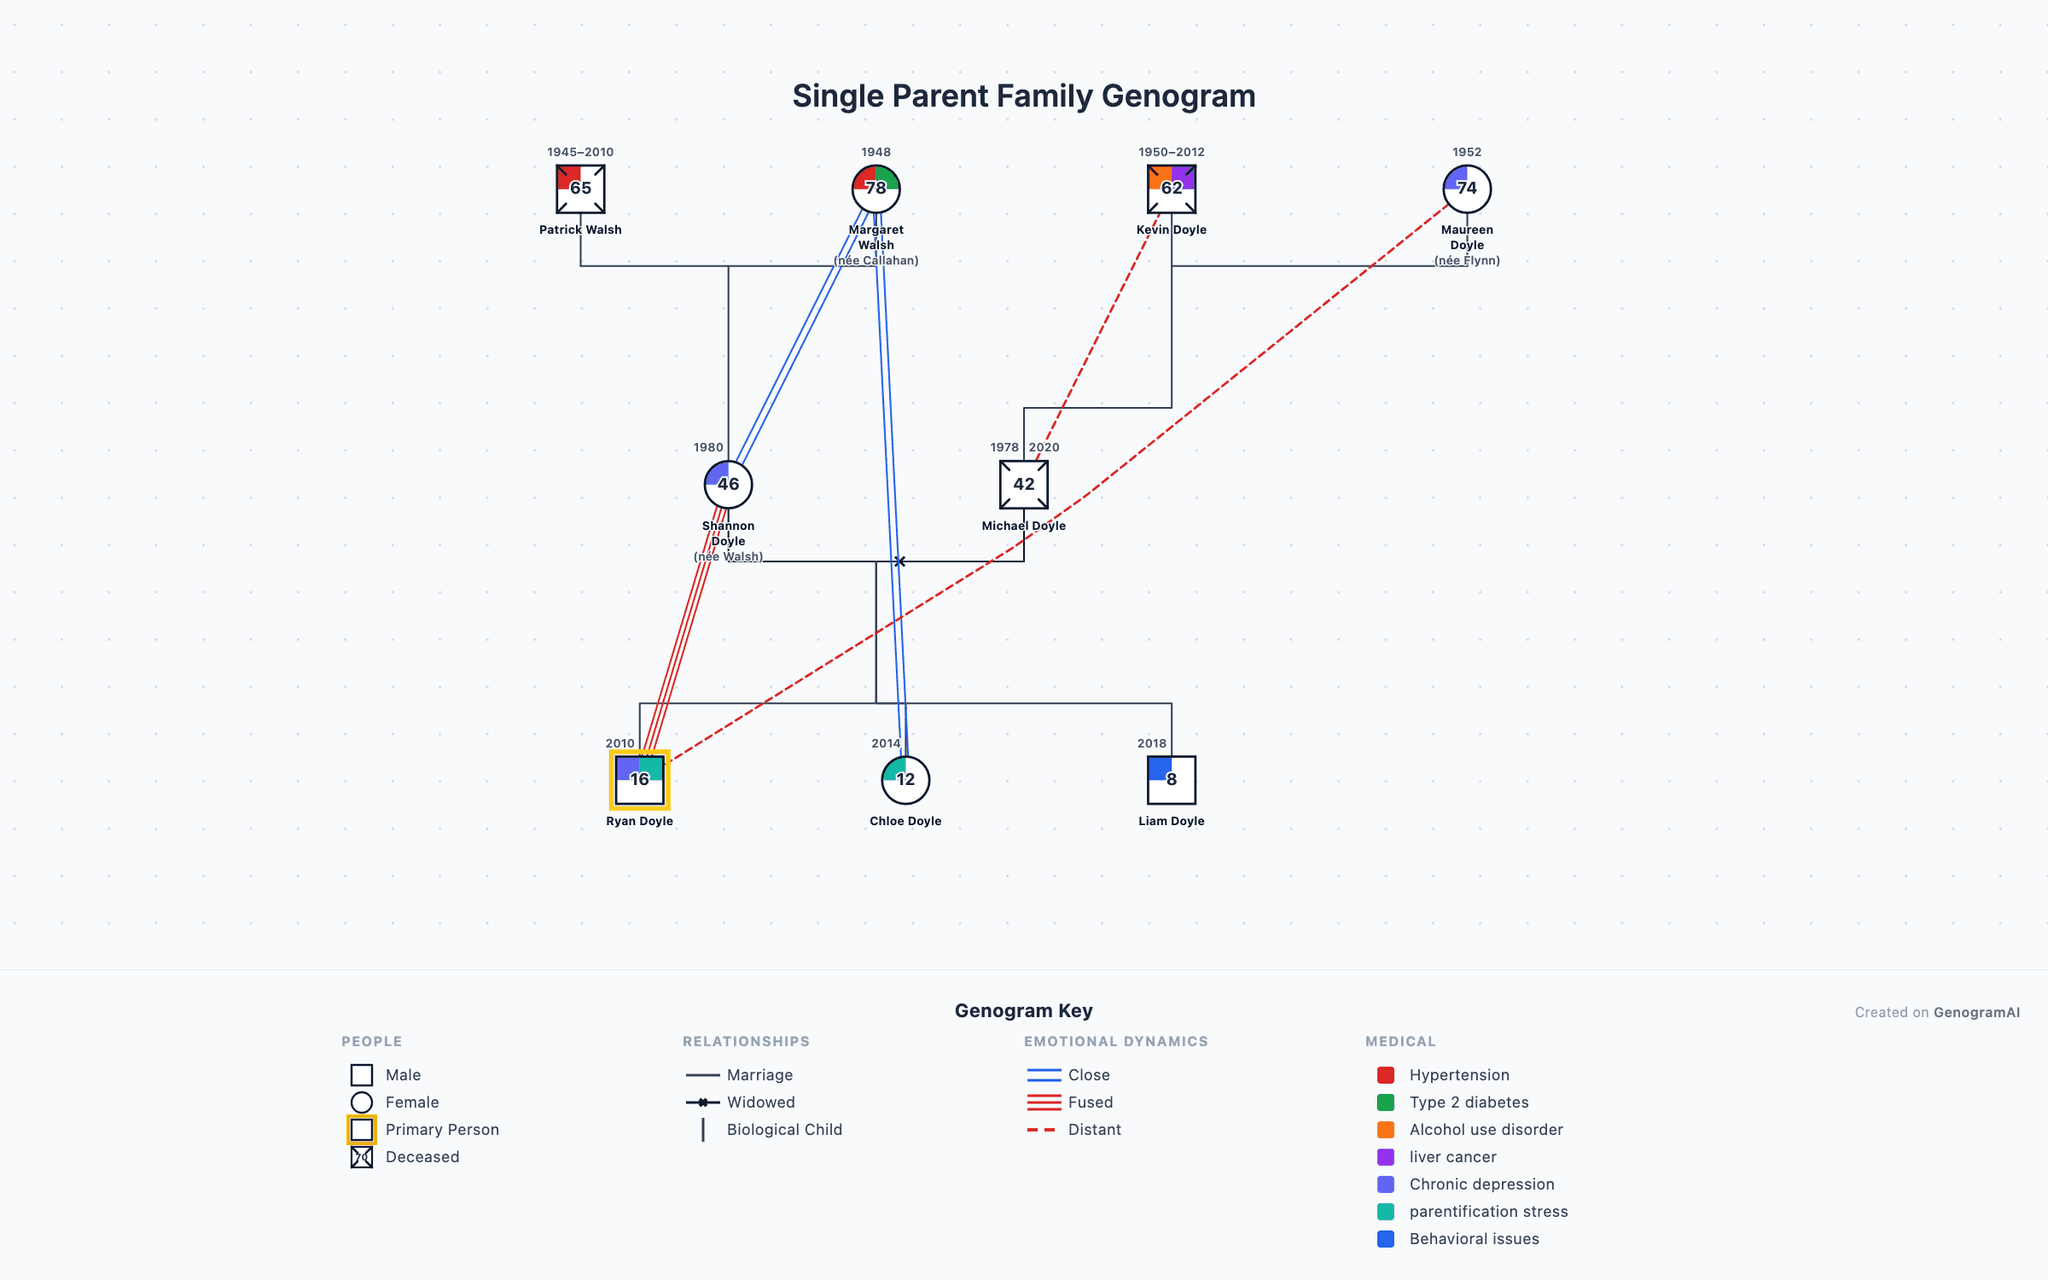
Single Parent Family Genogram
A genogram depicting a single mother raising three children after her husband\'s unexpected death.
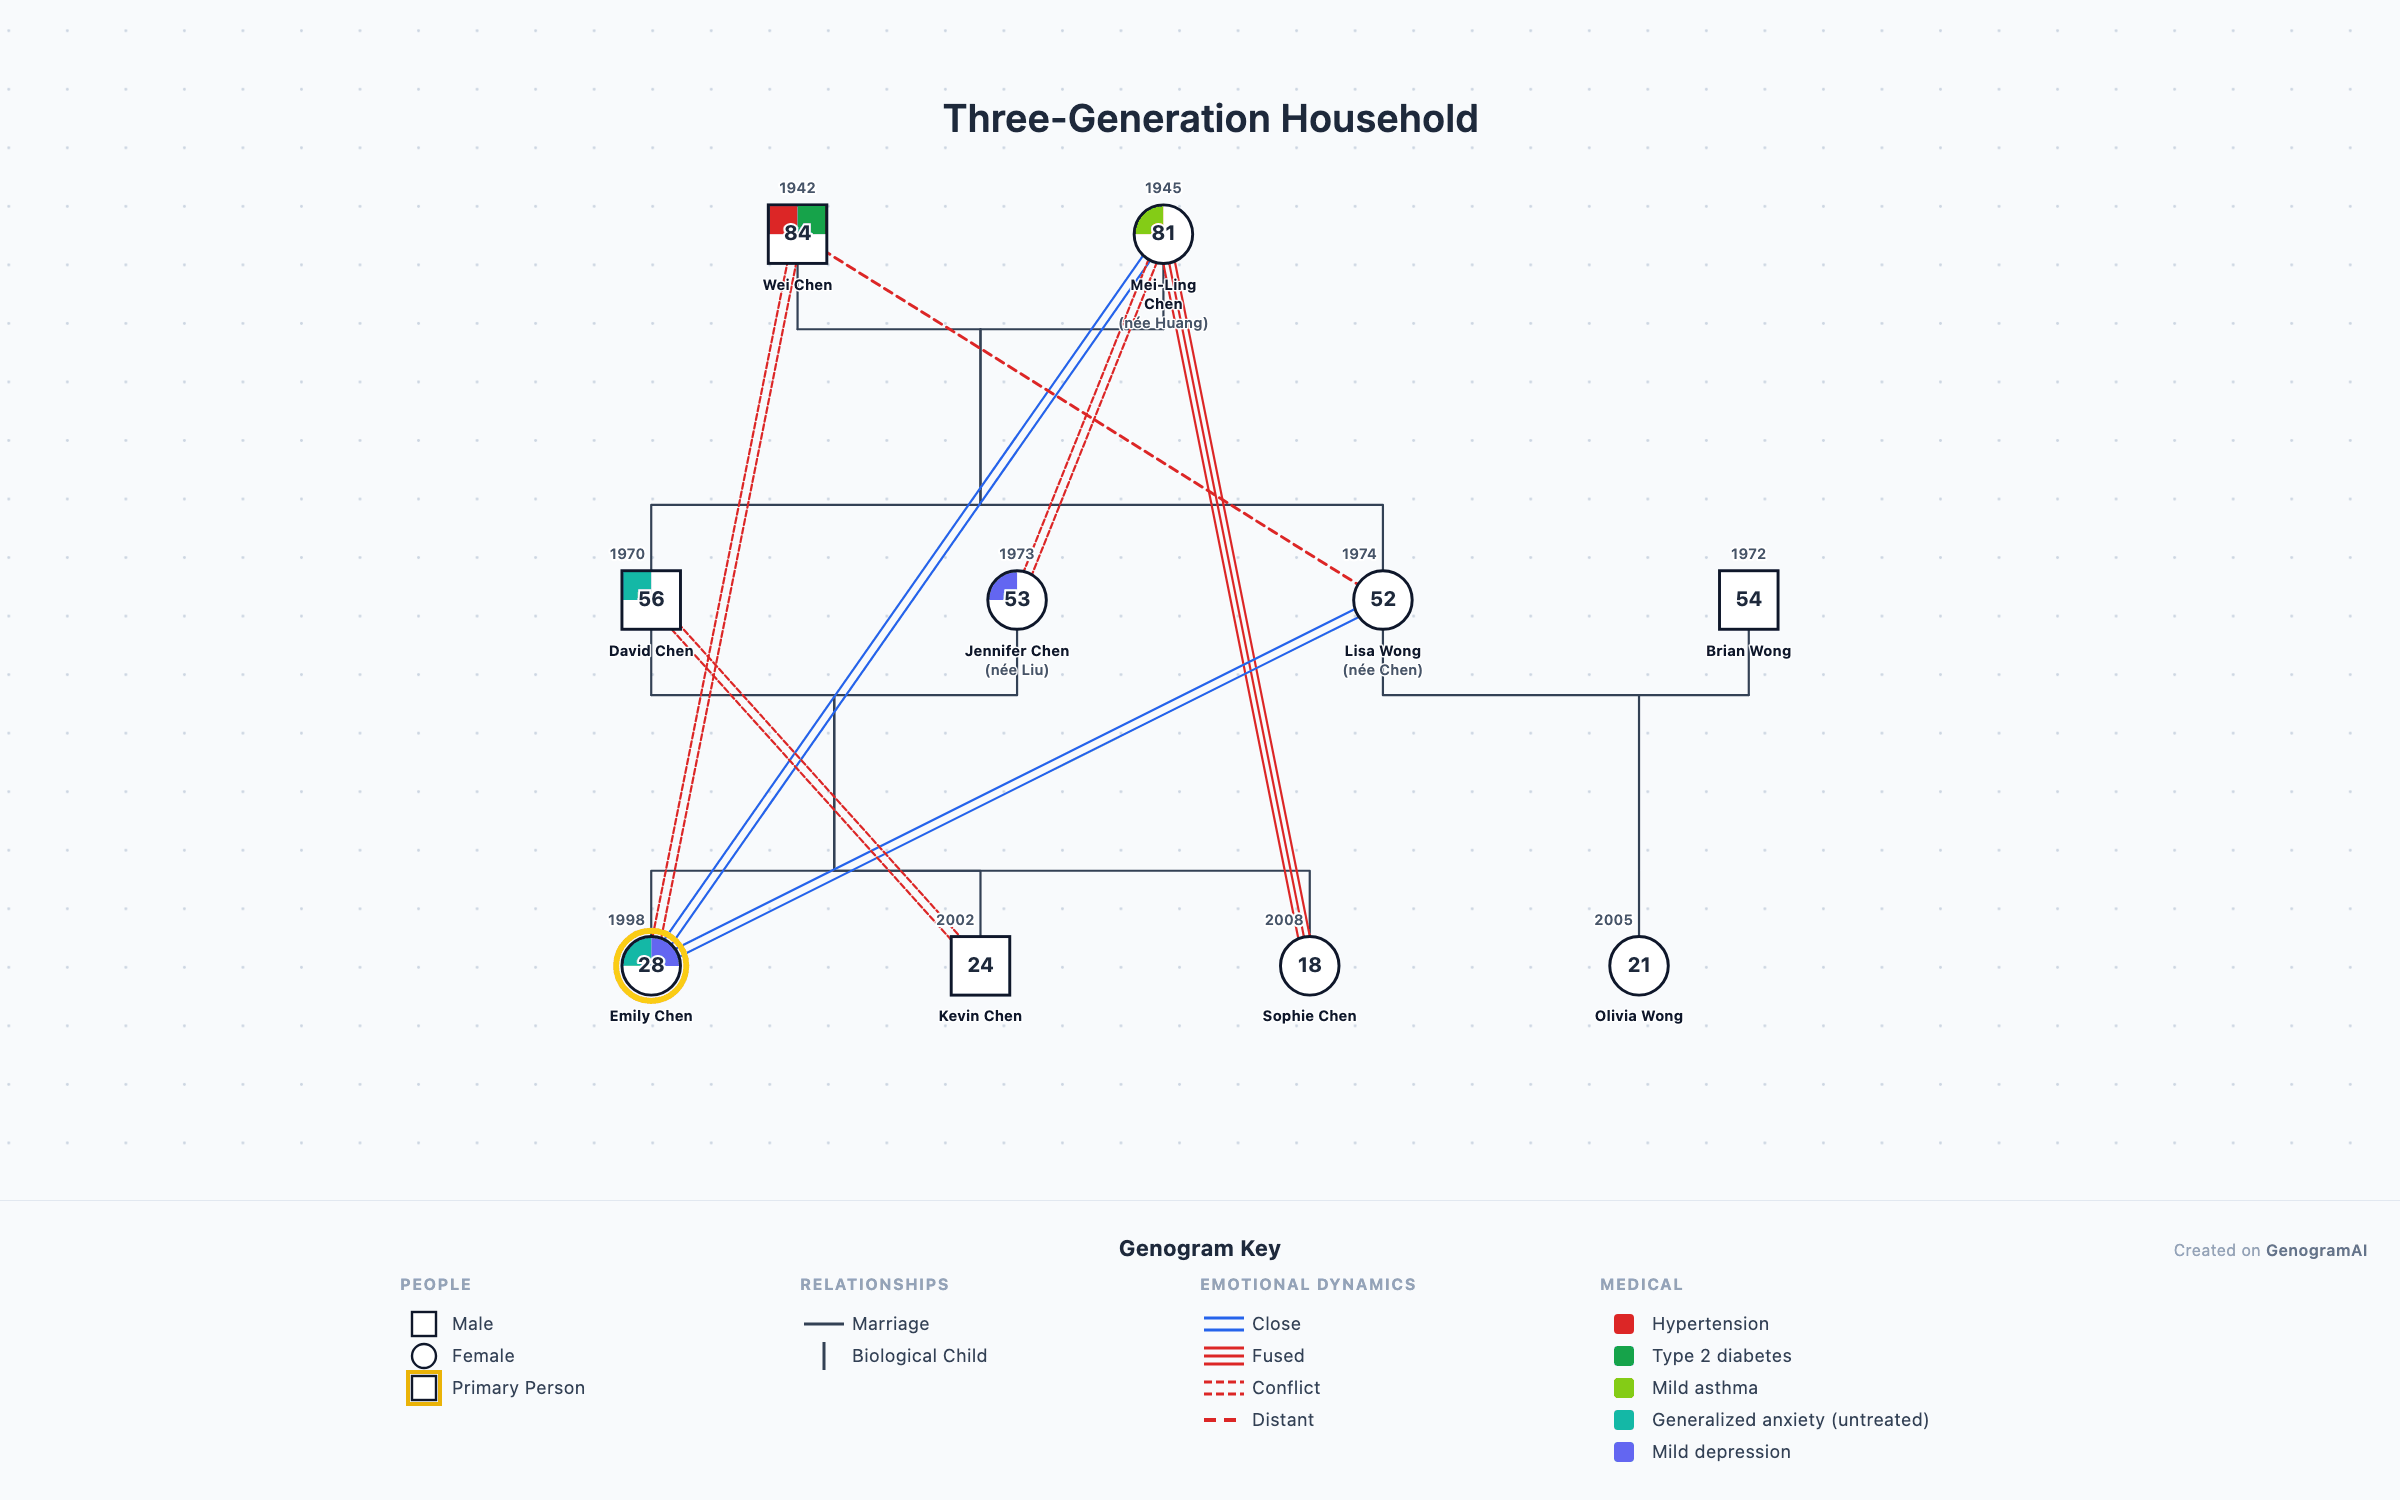
Three-Generation Household
A multigenerational Chinese-American family genogram illustrating three generations living under one roof.
Create Your Own Genogram
Use GenogramAI to build your own family genogram with AI assistance. Describe your family and let AI do the rest.
Educational disclaimer: This genogram example is an educational illustration of genogram notation and family systems concepts. Examples based on public figures use publicly available information. They are not clinical documents. All examples are intended for learning genogram symbols and patterns.