Launching Young Adults and the Sandwich Generation
Family life-cycle genogram of launching adult children and caring for an aging parent: boomerang child, empty nest, assisted living and caregiving.
Interactive Launching Young Adults and the Sandwich Generation
Click and drag to explore. Zoom with scroll.
Can't see the genogram? View in the GenogramAI Gallery
About This Genogram
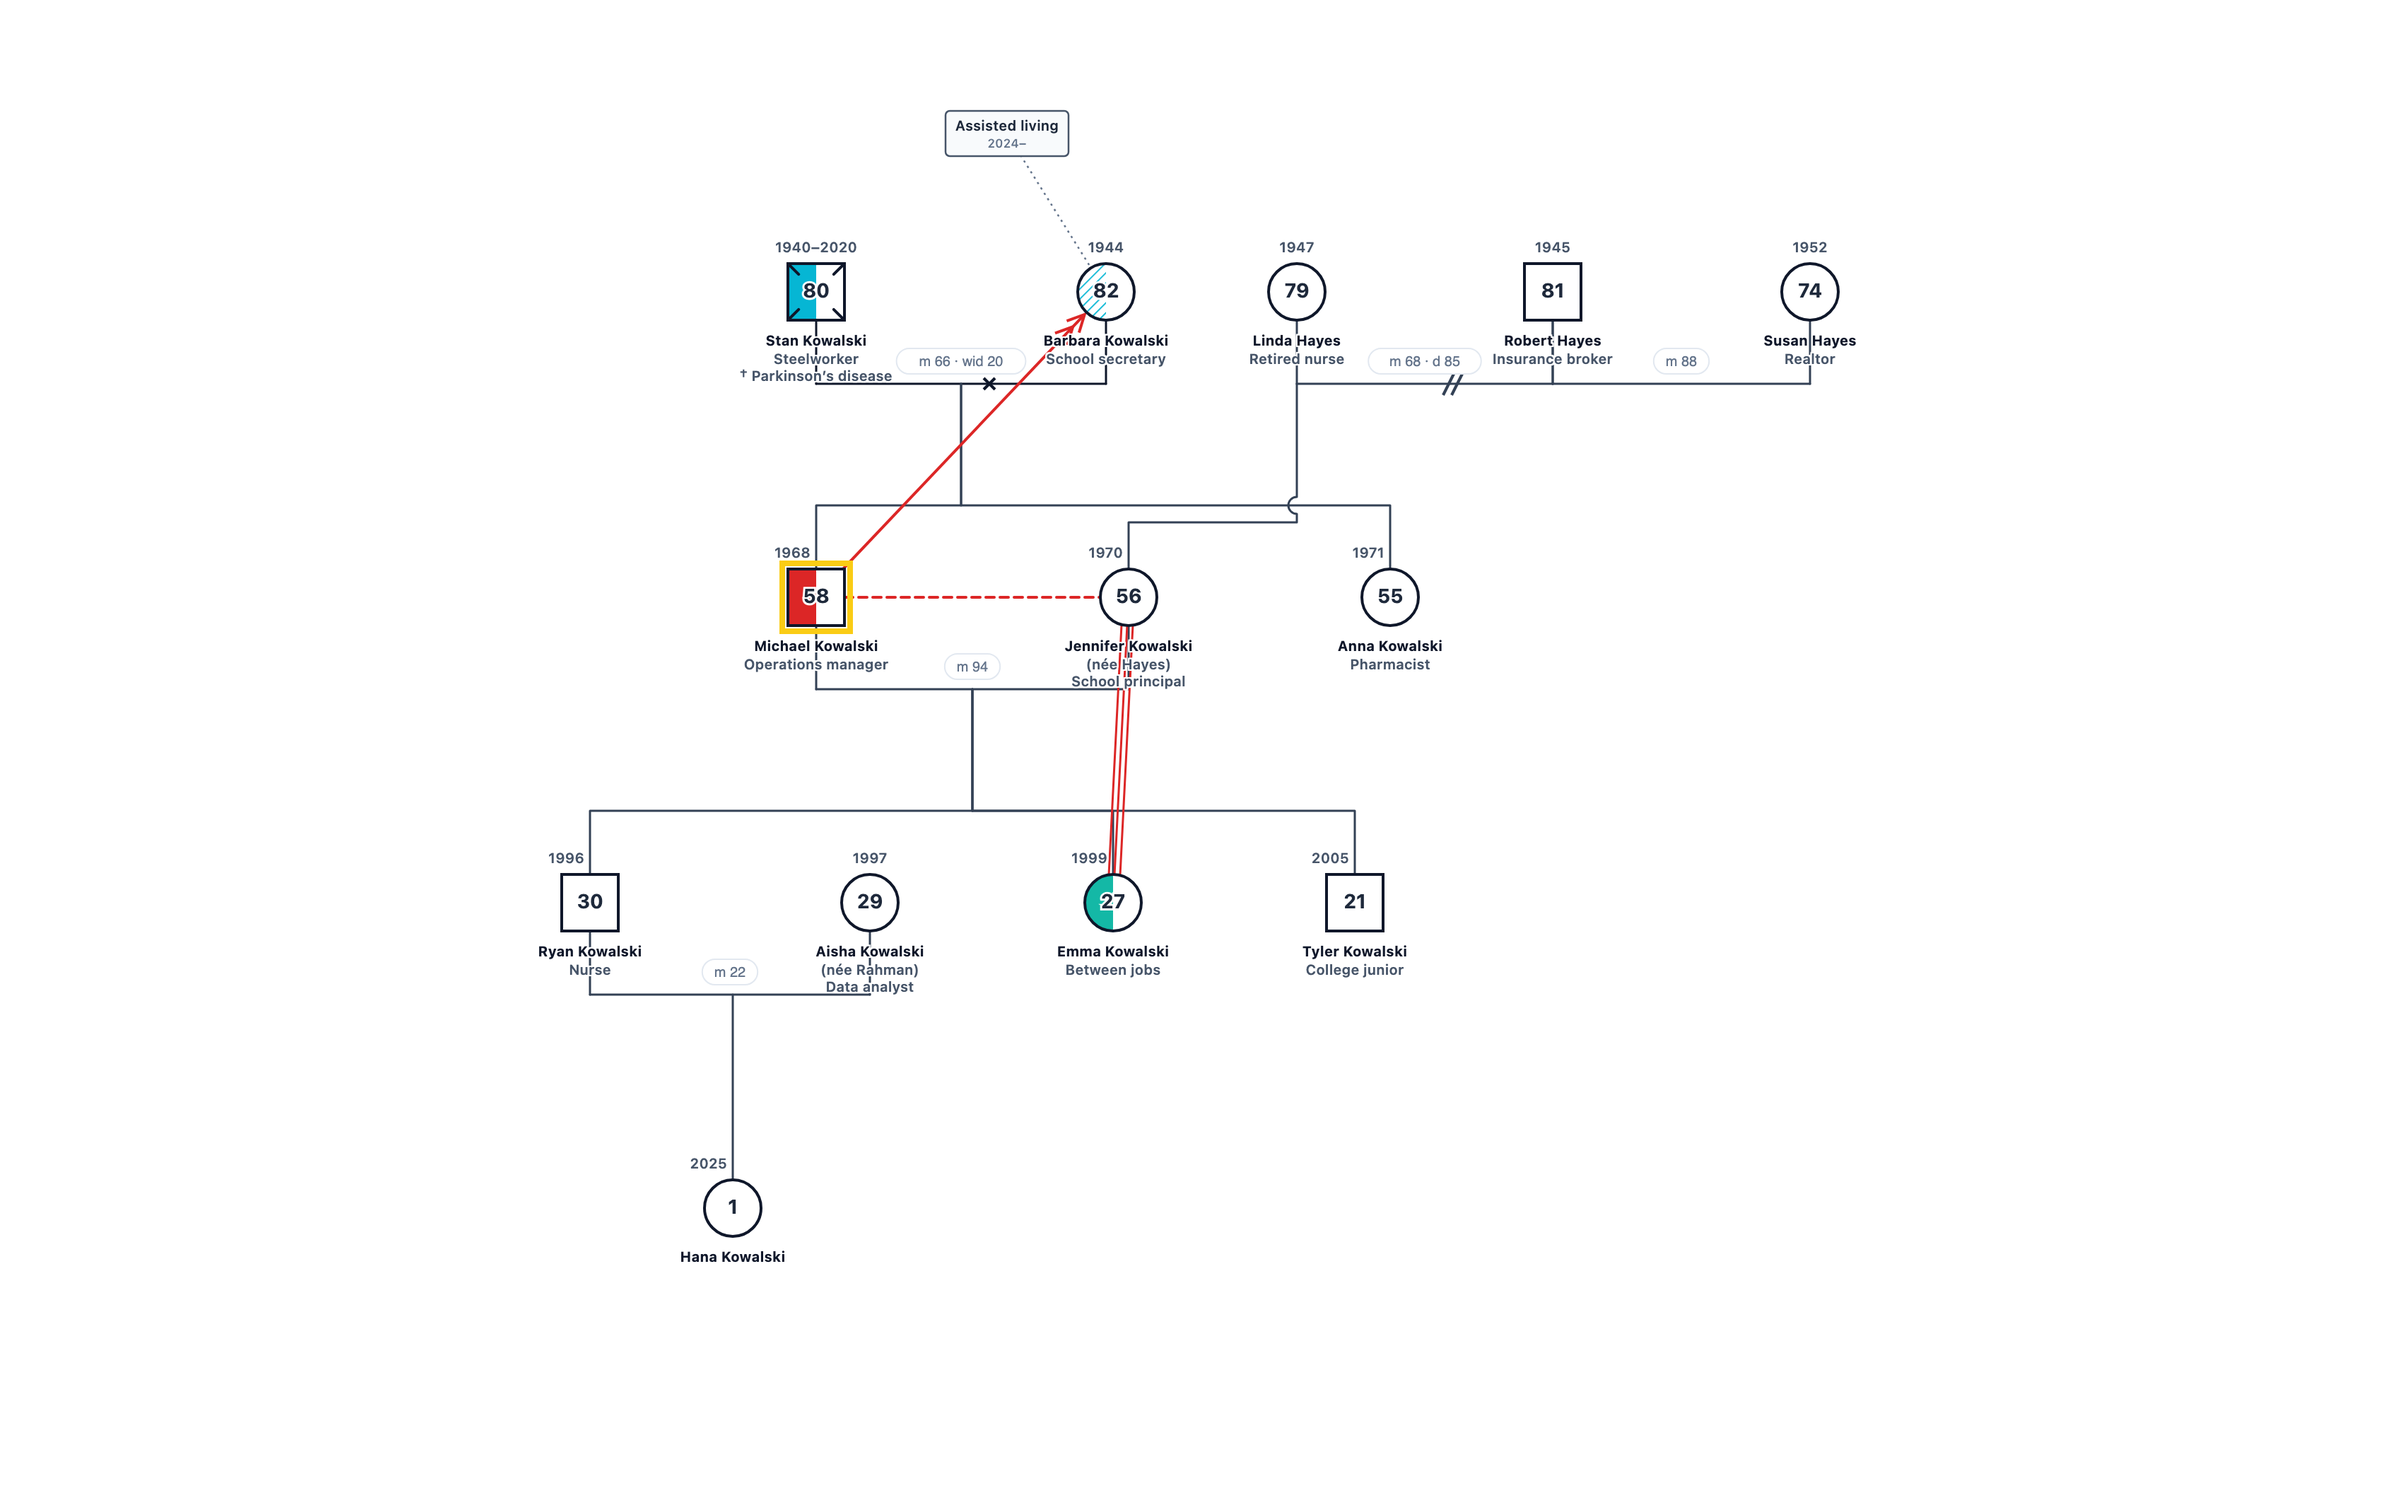
A family life-cycle genogram of a fictional Polish-American family in the launching stage: one son married with a new baby, a daughter who moved back home after a layoff, a youngest son away at college, and parents caring for a widowed grandmother who moved into assisted living. Shows a household boundary, an institution box and caretaking lines.
How to Read This Genogram
A family structure genogram maps household composition and biological or legal relationships across at least three generations using a standardized set of structural lines. Solid horizontal lines between two symbols indicate a committed partnership or marriage; a single diagonal slash through that line marks a separation, and a double slash marks a divorce. Children descend from the couple line on vertical drops, and their birth order runs left to right. Dashed lines or dotted horizontal connectors indicate step, foster, or adoptive bonds, so that a reader can distinguish biological parentage from the household arrangement in which a child was actually raised.
Reading a family structure genogram begins at the top generation and moves downward, noting who forms each household at each generational level. The key questions are: Which children grew up together? Which adults held parenting roles, and were those roles biological, legal, or both? Where do the generational boundaries fall? Households that contain members from more than one biological line, or that skip a generation, stand out visually and prompt the clinician to ask how those arrangements shaped each member's experience of family. Structure alone does not explain behavior, but it establishes the relational architecture on which emotional patterns are later mapped.
Key Patterns in This Genogram
Family Structure
How this family structure is represented using standard genogram notation.
Relationship Patterns
Key relationship dynamics and emotional bonds within the family system.
Clinical Application
How professionals use this type of genogram in assessment and treatment.
Family Analysis
Michael (58) and Jennifer (56) Kowalski expected an empty nest when their youngest, Tyler, left for college in 2023. Instead, their daughter Emma (27) moved home in 2024 after being laid off, and Michael’s mother Barbara, widowed in 2020 and now showing signs of dementia, moved into assisted living the same year. Their eldest, Ryan, married Aisha in 2022, moved to Seattle and had their first grandchild, Hana, in 2025.
The emotional lines show how the system absorbed these changes. Jennifer and Emma have become fused; Emma’s anxiety and job search are Jennifer’s daily focus. Michael carries his mother’s care (caretaking line) and the couple has grown distant. On Jennifer’s side, her parents’ divorce in 1985 and her father’s remarriage are part of how she understands marriage under strain.
For teaching, the chart illustrates the overlap of two life-cycle transitions: launching young adults and caring for the oldest generation. A clinician might use it to help the couple reclaim time for themselves and to help Emma relaunch without either parent over-functioning.
Build a Similar Genogram
A practitioner documenting a family similar to this one would typically record three generations of household composition, significant life events such as births, deaths, marriages, and separations, any relevant medical or mental health history, and the quality of key relationships between members. That information comes from a combination of the client's verbal account, intake questionnaires, and, where available, collateral records. The completed diagram captures both the factual structure of the family and the practitioner's clinical observations about relational patterns, making it a reference that can be shared across disciplines or reviewed at future stages of treatment.
GenogramAI's AI genogram generator allows you to build a diagram like this one from a plain-language description of the family. You type or paste a narrative, such as the basic structure and any key relationships or health history you want to include, and the AI parses that text, places the correct symbols, draws the appropriate relationship lines, and arranges the layout automatically. The result is a fully editable diagram that you can refine, annotate, and export for clinical records or educational use. Try the AI genogram creator to generate your own genogram from a text description in seconds.
Genogram Symbols Used in This Example
The following standard genogram symbols appear in the Launching Young Adults and the Sandwich Generation. Each symbol follows McGoldrick and Gerson clinical notation conventions.
Person Symbols
- Male (Square)
- A square represents a male family member.
- Female (Circle)
- A circle represents a female family member.
- Index person (highlighted outline)
- The person at the centre of the assessment is drawn with a highlighted outline.
- Deceased (X)
- An X through the symbol marks a person who has died; birth and death years are written above it.
- Age inside the symbol
- The current age (or age at death) is written inside each symbol, with years above it.
Couples
- Marriage
- A solid line between partners; the marriage year is written on the line (m 90 = married 1990).
- Divorce
- Two slashes across the couple line mark a divorce, with the year (d 02).
- Widowed
- A small x on the couple line marks the end of a marriage through death (wid 15).
Home and Care
- Household
- A boundary around the people who share a home, with the year it began (shown in the editor’s Households view).
- Institution box
- A small labelled box (prison, residential treatment, assisted living) with years, linked to the person by a dotted line.
Emotional Relationships
- Fused
- Three parallel lines mark an over-close, fused relationship.
- Distant
- A dashed line marks emotional distance.
- Caretaking
- An arrow from the caregiver to the person cared for marks a caretaking role.
Medical
- Medical shading
- The left half of a symbol is shaded for a physical or mental illness and the bottom half for alcohol or drug use; each condition has its own colour, listed in the key. Hatching means suspected, a partial fill means in recovery.
Related Resources
- See our guide to genograms for elderly care.
- The caretaker relationship symbol shows who carries the care of an aging parent.
- This chart follows the standard 3-generation genogram layout.
- Life-cycle stress is central to Bowen family systems genograms.
Frequently Asked Questions
What is the launching stage of the family life cycle?
How does the genogram show who lives at home?
How is assisted living shown?
What clinical patterns are visible?
Related Genogram Examples
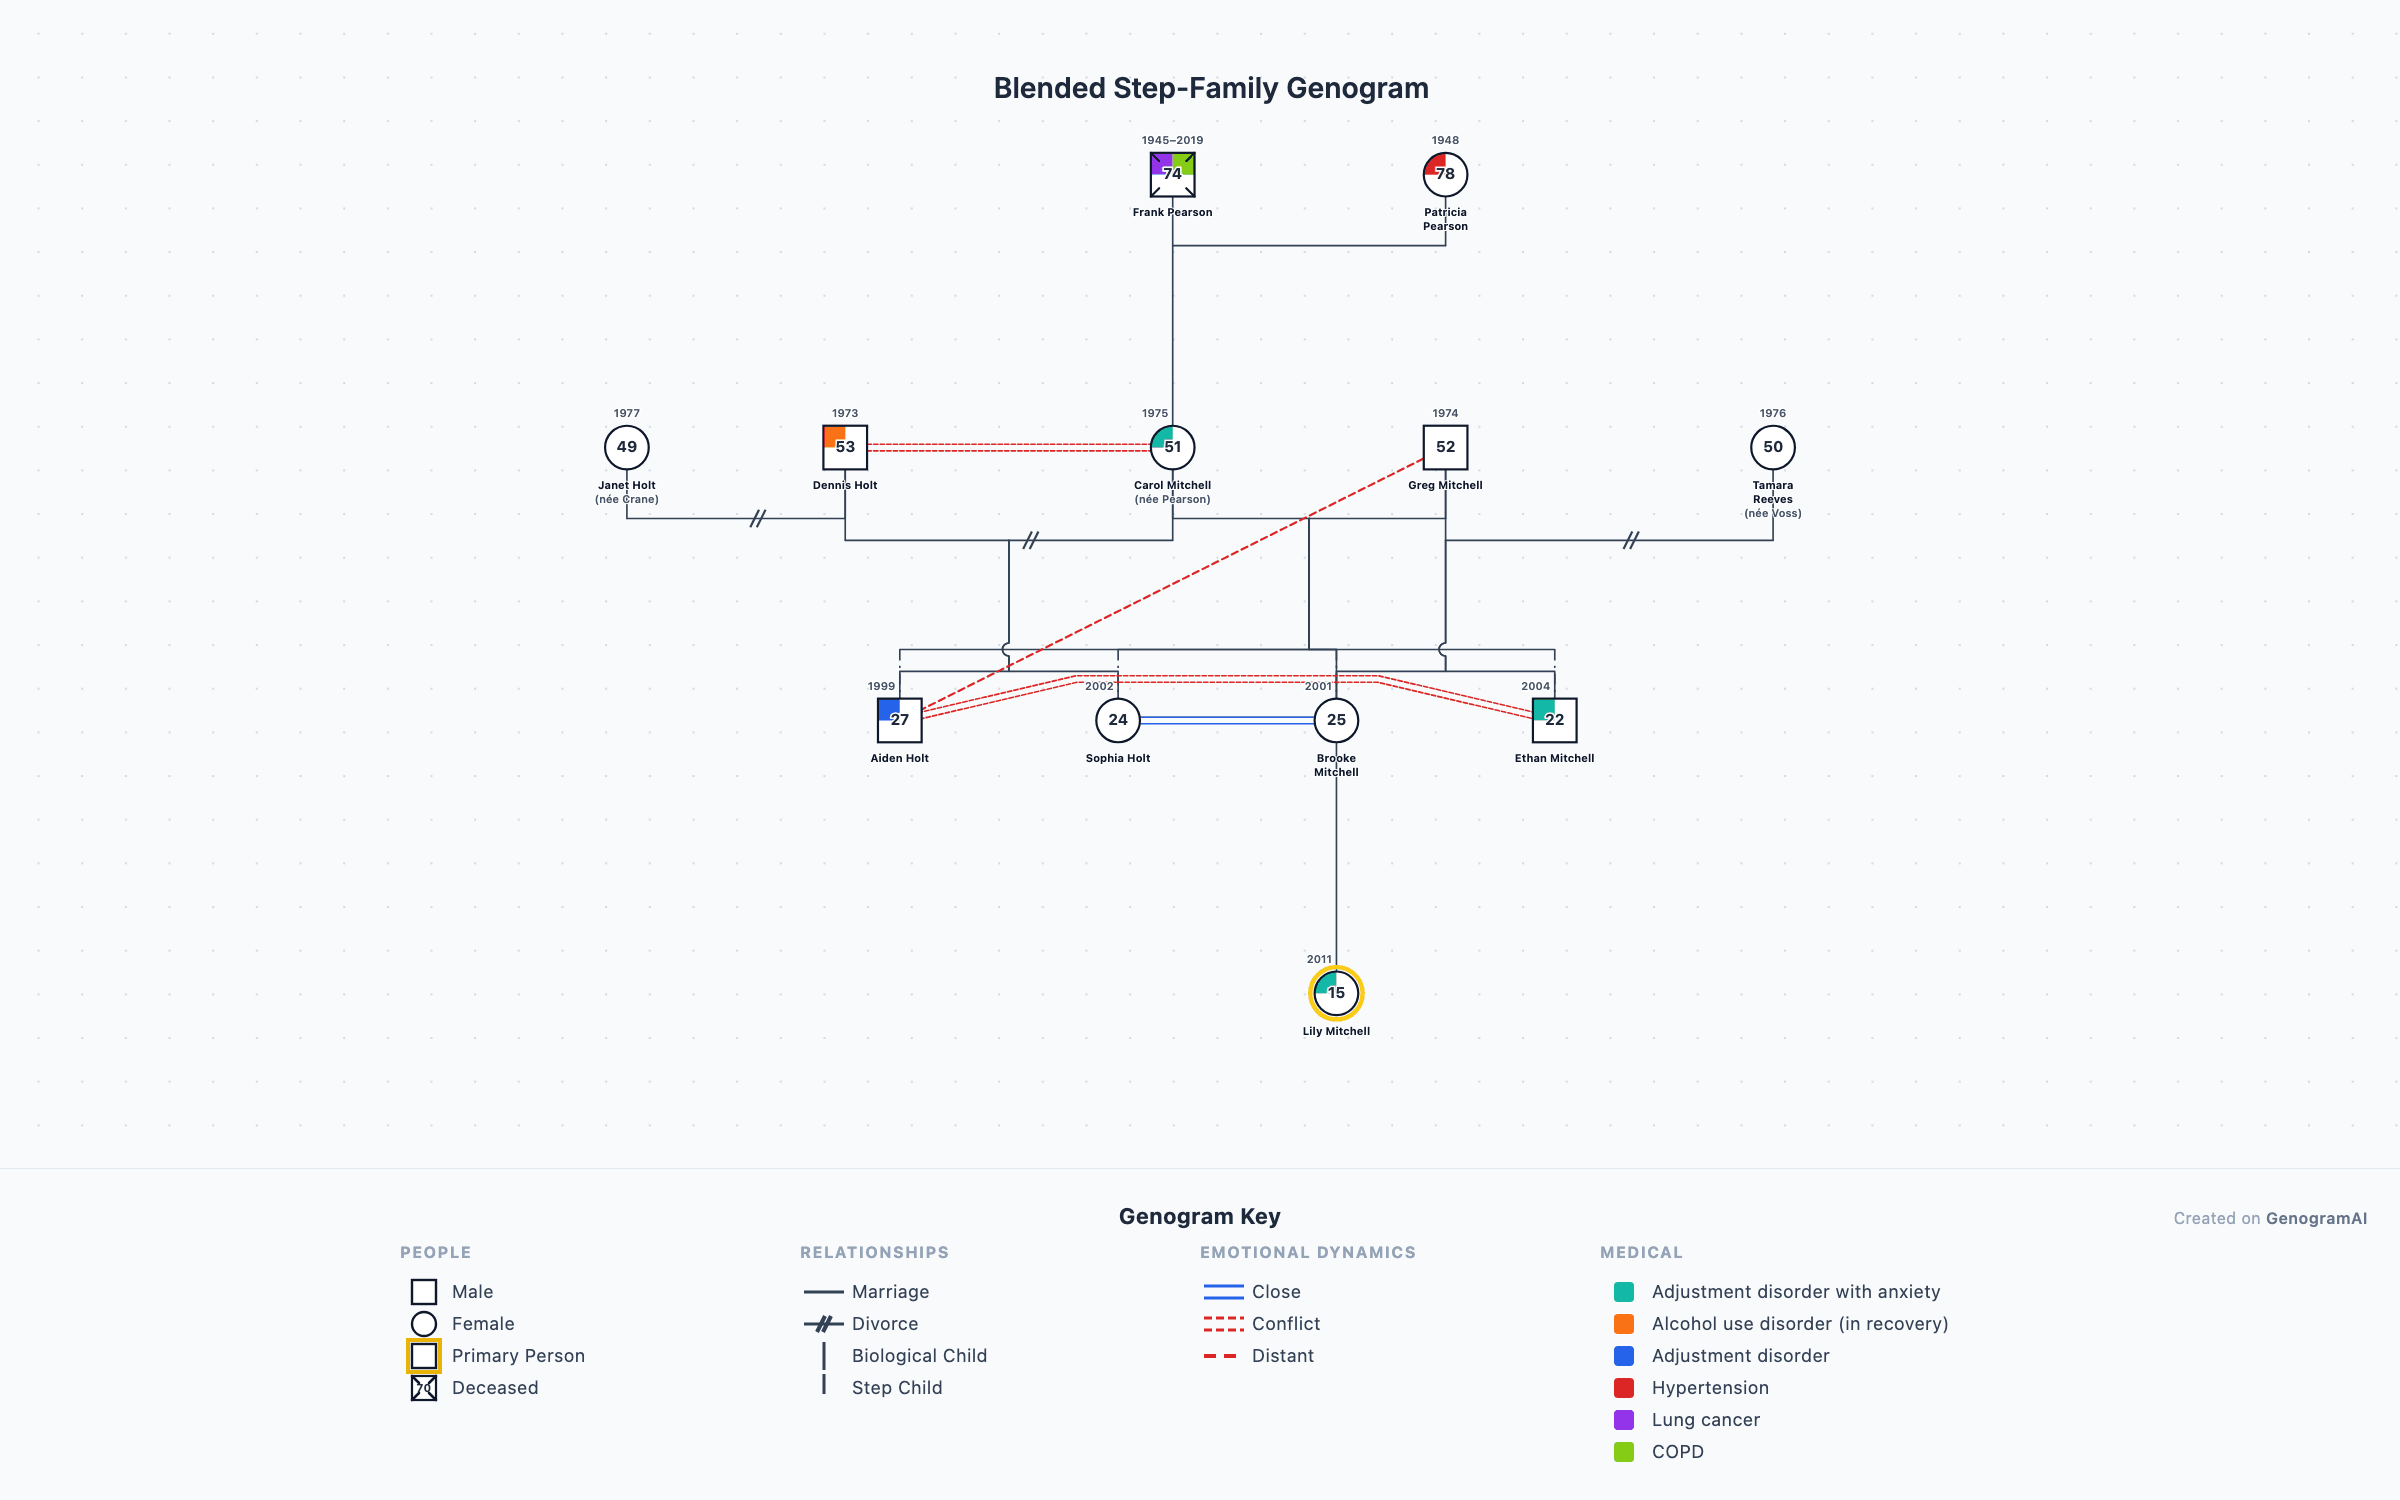
Blended Step-Family Genogram
A complex blended step-family genogram showing two divorced parents who remarried each other, each bringing children from prior marriages.
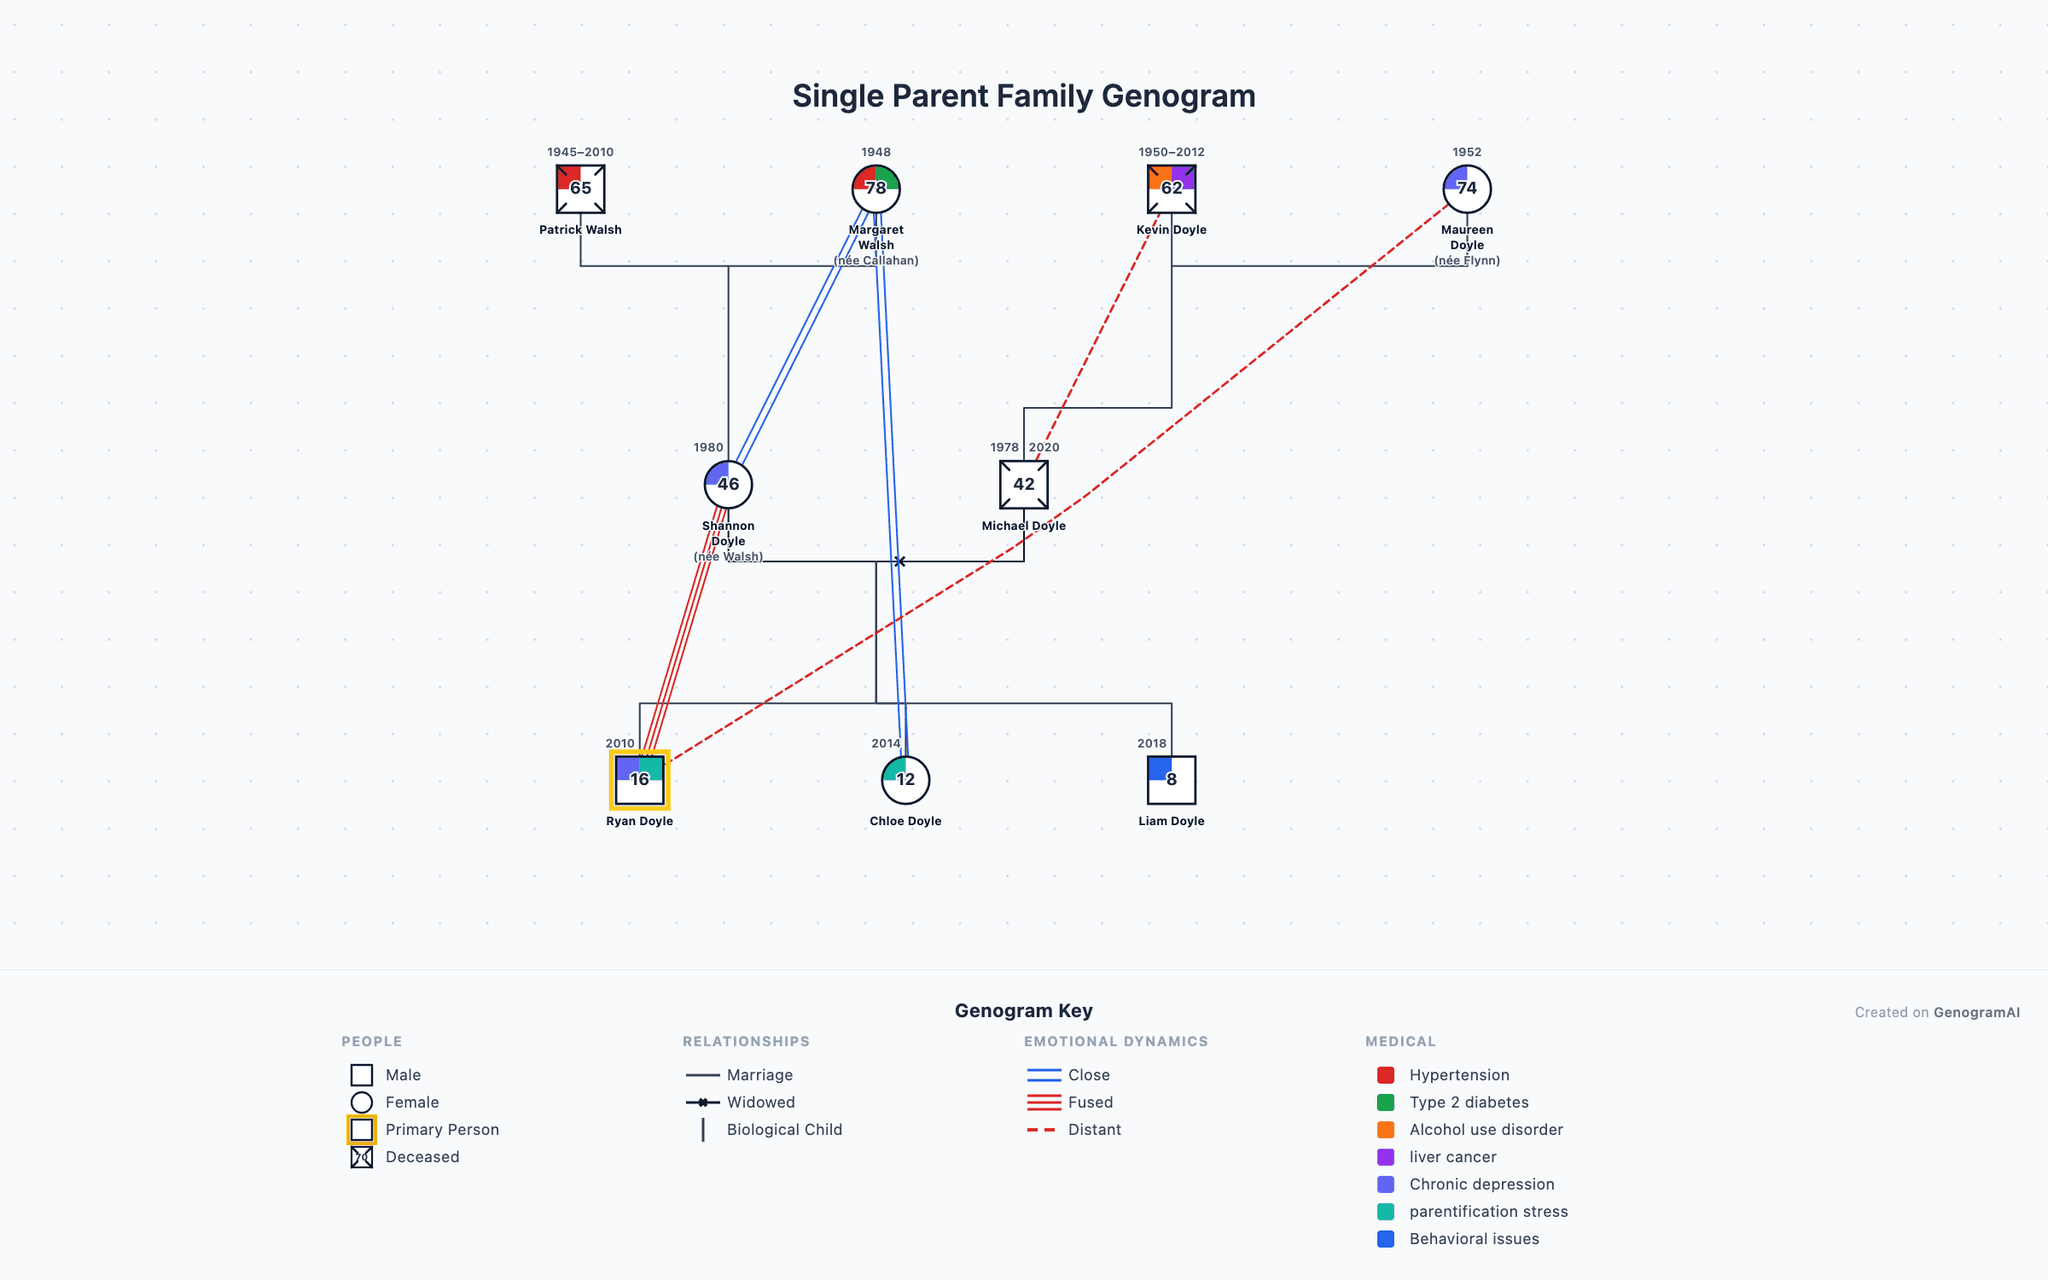
Single Parent Family Genogram
A genogram depicting a single mother raising three children after her husband\'s unexpected death.
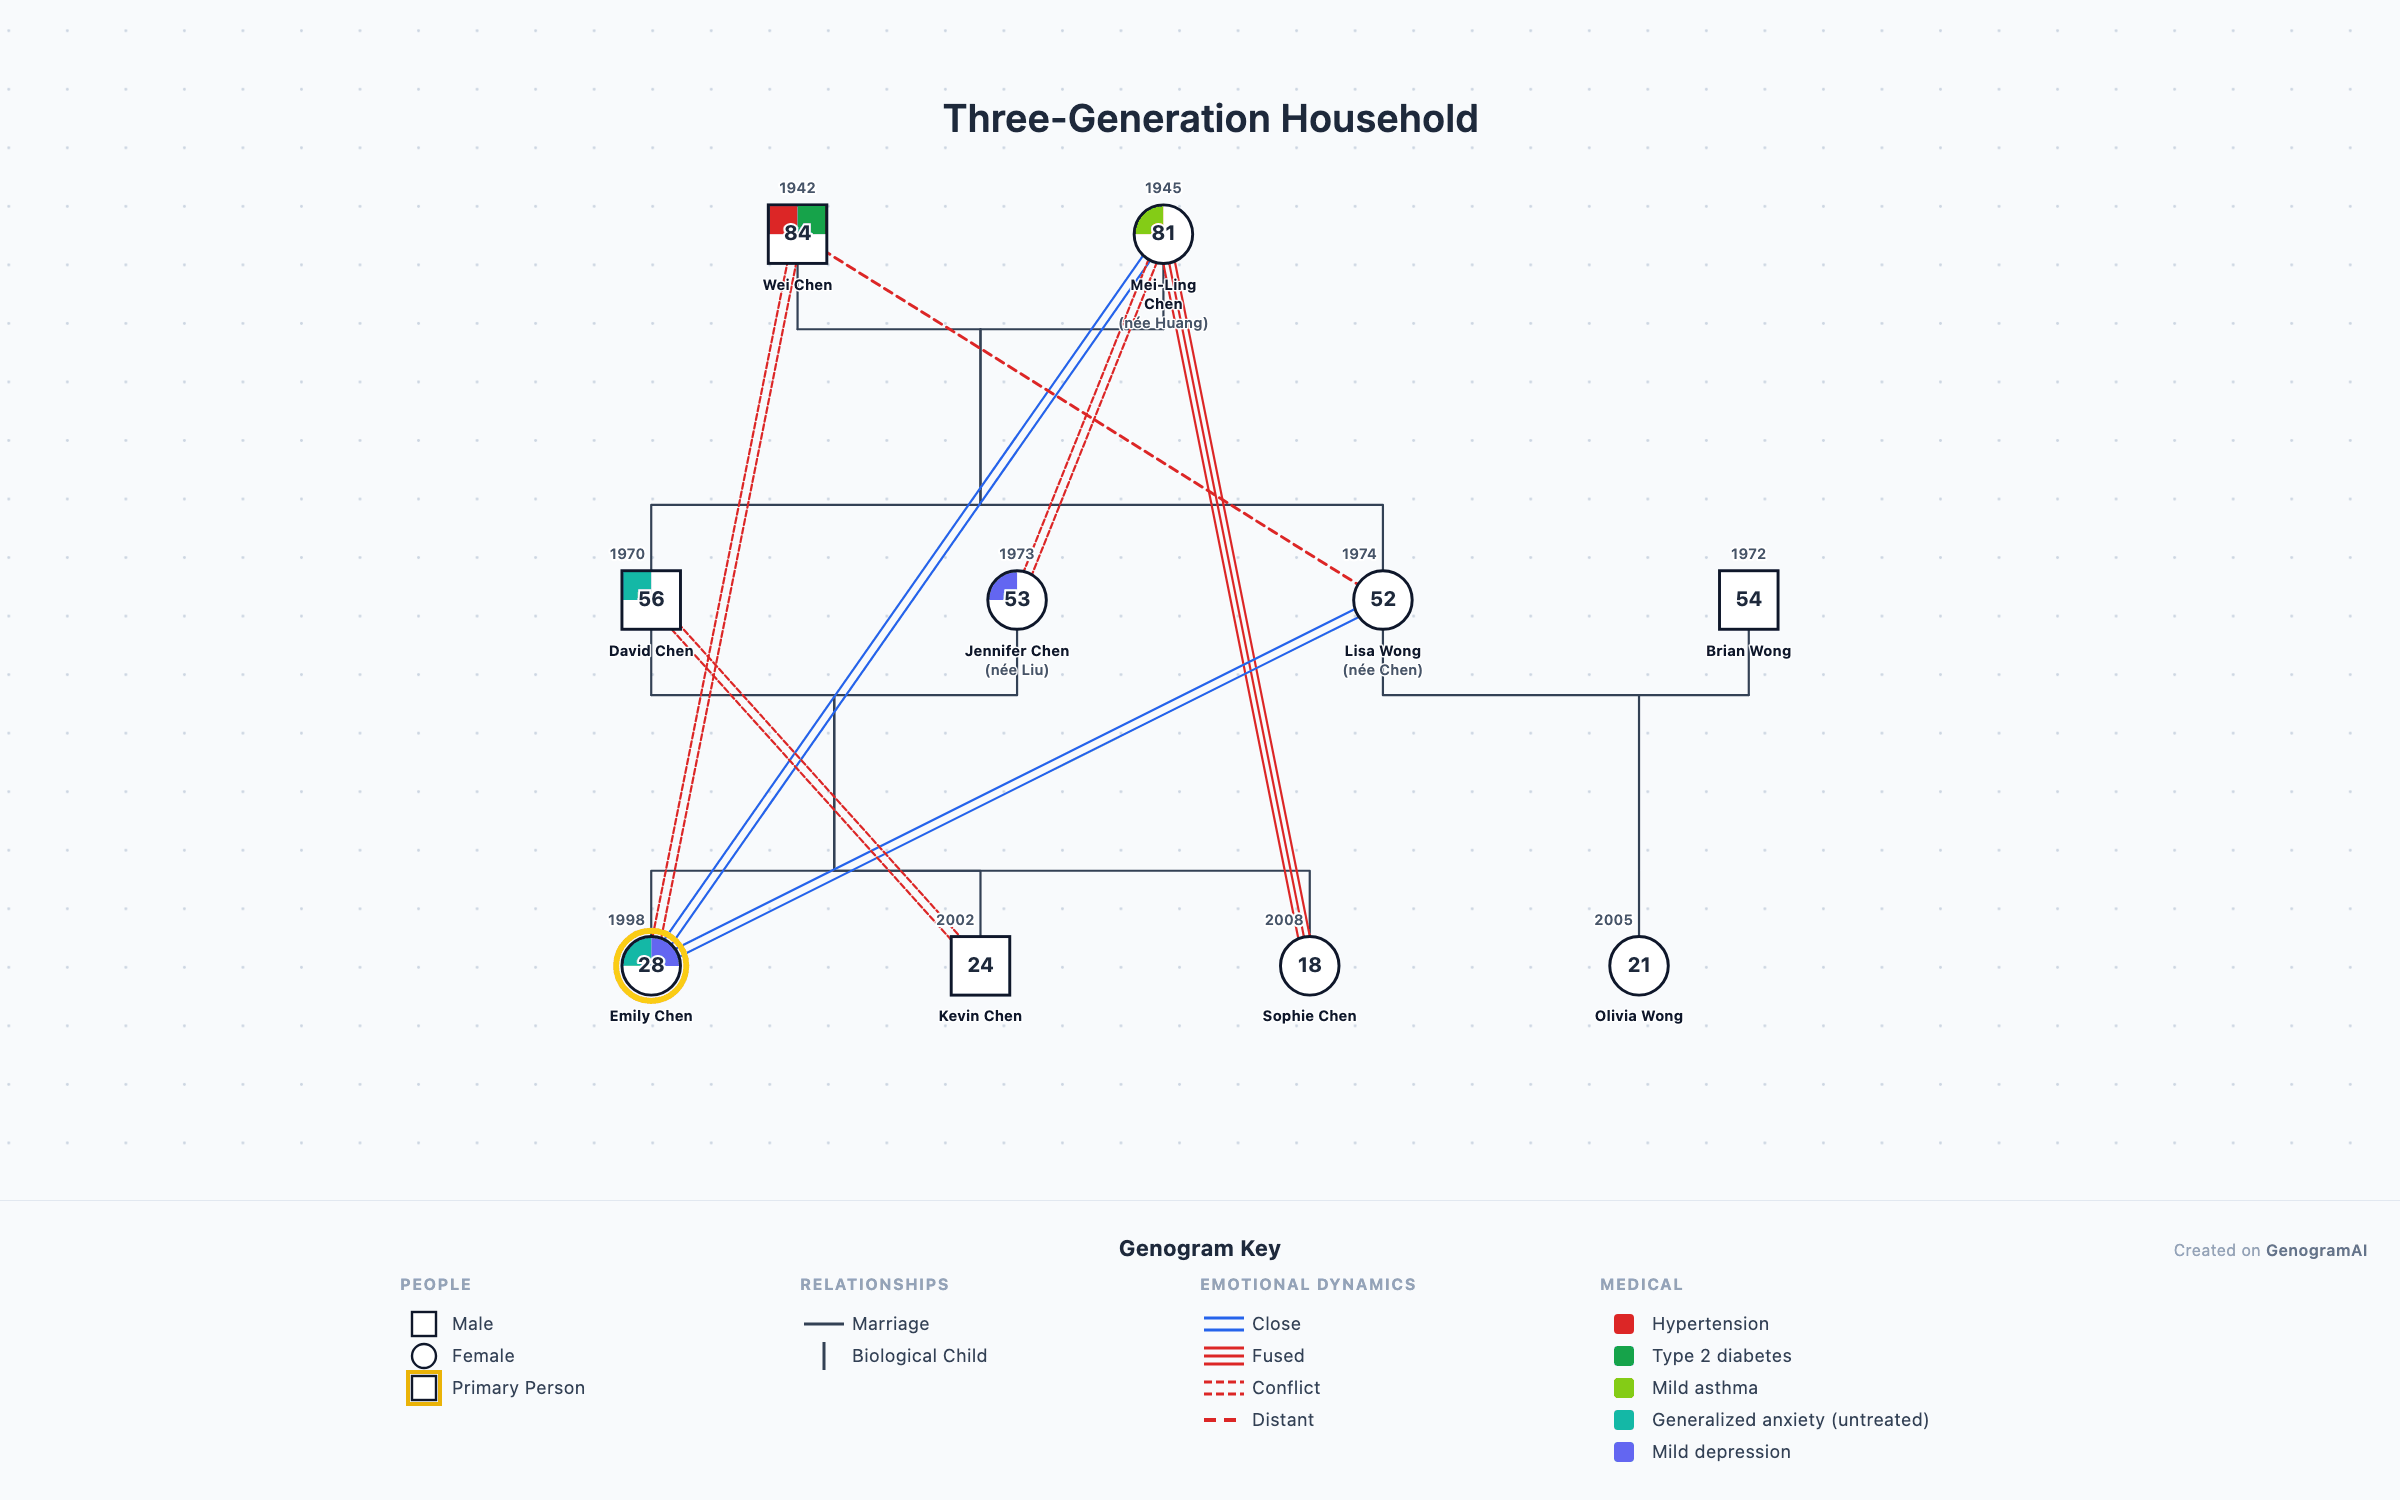
Three-Generation Household
A multigenerational Chinese-American family genogram illustrating three generations living under one roof.
Create Your Own Genogram
Use GenogramAI to build your own family genogram with AI assistance. Describe your family and let AI do the rest.
Educational disclaimer: This genogram example is an educational illustration of genogram notation and family systems concepts. Examples based on public figures use publicly available information. They are not clinical documents. All examples are intended for learning genogram symbols and patterns.