School Counselor Genogram: Student in Two Households
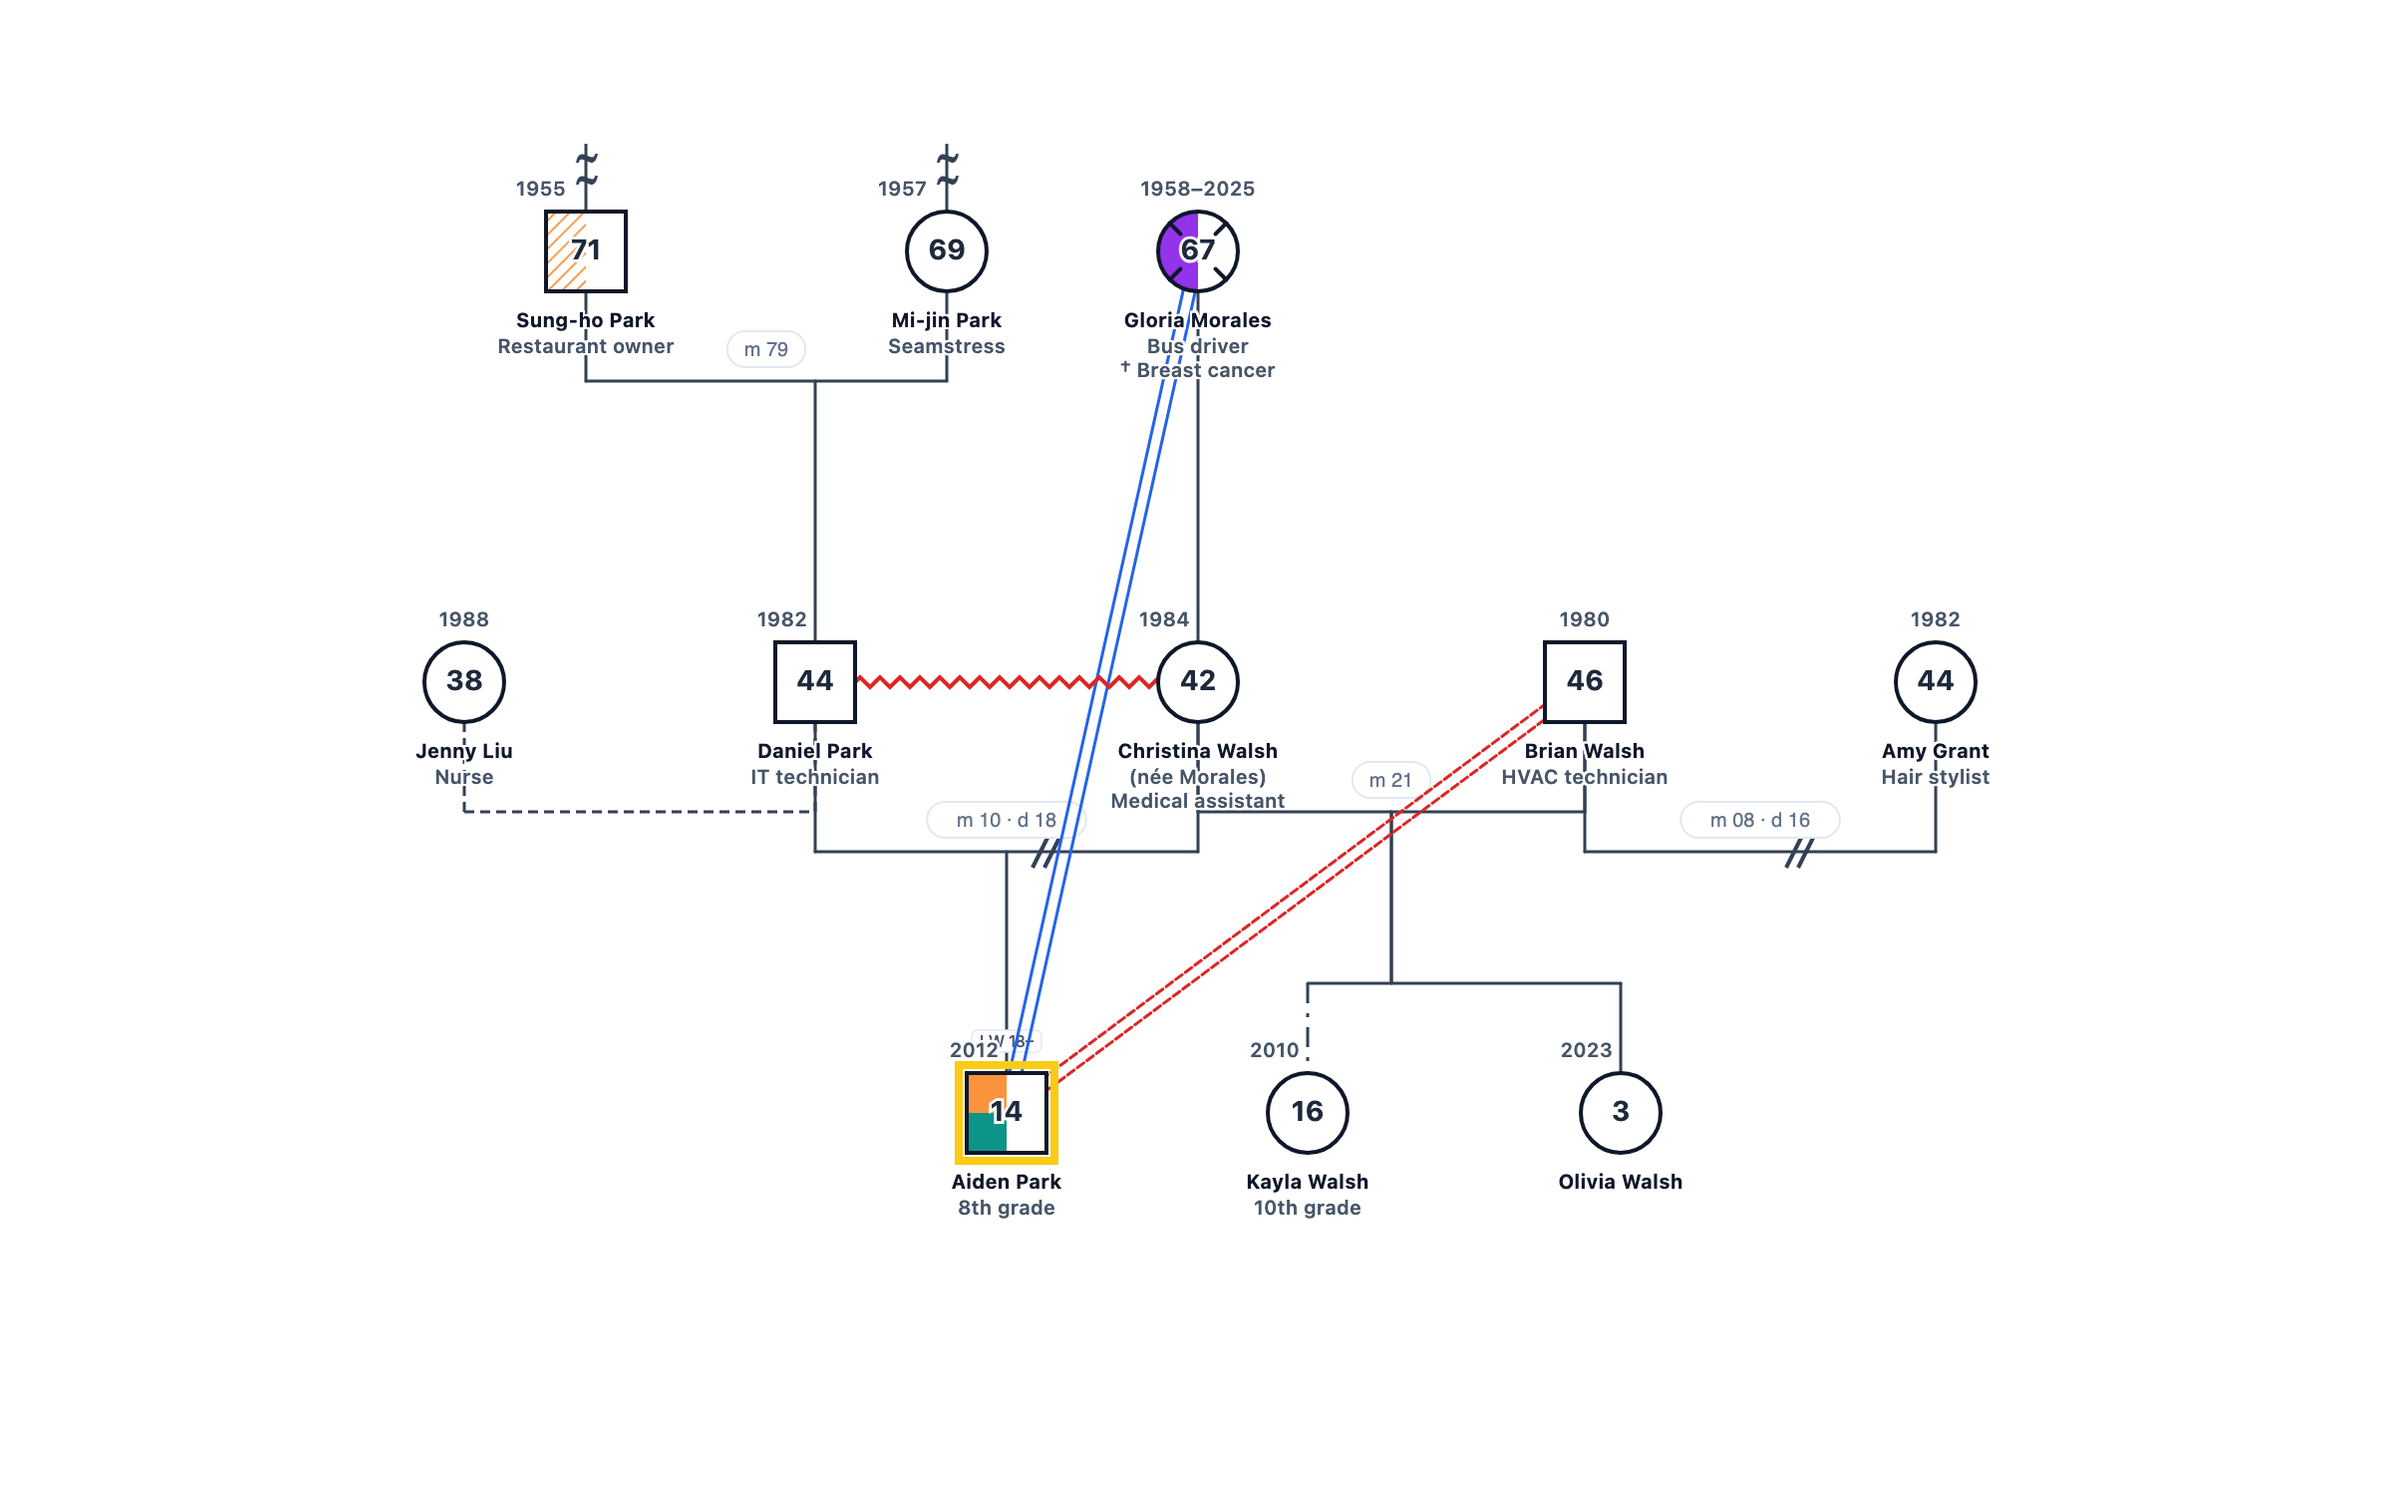
Genogram for school counselors: a student in two households after divorce, step and half siblings, ADHD and dyslexia, and a recent grandparent death.
Interactive School Counselor Genogram: Student in Two Households
Click and drag to explore. Zoom with scroll.
Can't see the genogram? View in the GenogramAI Gallery
About This Genogram
A school counseling genogram of a fictional 14-year-old student with ADHD and dyslexia who lives between his mother’s remarried household and his father’s apartment. It shows divorce and remarriage, a step-sister and a half-sister, cohabitation, a grandmother who died this year and the presenting problem, with households marked for the editor’s Households view.
How to Read This Genogram
Standard genogram notation follows the conventions established by McGoldrick, Gerson, and Petry, which are widely adopted across social work, marriage and family therapy, psychology, and medicine. Squares represent male-identified individuals, circles represent female-identified individuals, and an X through either symbol indicates the person is deceased. Horizontal lines connect partners, with a single slash for separation and a double slash for divorce. Vertical and diagonal lines descend to children, who are arranged in birth order from left to right within a generation. A three-generation diagram is the minimum recommended for clinical use because it provides enough generational depth to identify repeating patterns.
Clinical applications range from intake assessment to treatment planning and outcome review. In a first session, a clinician sketching a genogram with a client gathers structural and historical data while simultaneously building rapport through collaborative storytelling. The resulting diagram then guides the clinician toward hypotheses about symptom function, family roles, and relational resources available to the client. In subsequent sessions the genogram can be updated as new information surfaces, and tracking those additions over time often reveals how the client's understanding of their own family history shifts in parallel with therapeutic progress.
Key Patterns in This Genogram
Family Structure
How this family structure is represented using standard genogram notation.
Relationship Patterns
Key relationship dynamics and emotional bonds within the family system.
Clinical Application
How professionals use this type of genogram in assessment and treatment.
Family Analysis
Aiden Park (14) is in 8th grade. He has ADHD and dyslexia and was referred to the school counselor in the fall after his grades fell through the previous spring. His parents, Daniel and Christina, divorced in 2018. He lives with his mother during the school week and spends alternate weekends with his father, who has lived with his partner Jenny since 2022.
His mother remarried in 2021. Her husband Brian brought his daughter Kayla (16) into the home, and their daughter Olivia was born in 2023. The conflict line between Aiden and Brian and the hostile line between his parents show the tension Aiden carries between homes. His paternal grandfather Sung-ho has suspected, undiagnosed ADHD, which can help normalise Aiden’s diagnosis for the family.
The key recent event is the death of his maternal grandmother Gloria in May 2025. She was one of Aiden’s closest relationships, and the timing matches the drop in his grades. A counselor can use the genogram to plan support around the loss, coordinate with both households and set up accommodations for his learning needs.
Build a Similar Genogram
A practitioner documenting a family similar to this one would typically record three generations of household composition, significant life events such as births, deaths, marriages, and separations, any relevant medical or mental health history, and the quality of key relationships between members. That information comes from a combination of the client's verbal account, intake questionnaires, and, where available, collateral records. The completed diagram captures both the factual structure of the family and the practitioner's clinical observations about relational patterns, making it a reference that can be shared across disciplines or reviewed at future stages of treatment.
GenogramAI's AI genogram generator allows you to build a diagram like this one from a plain-language description of the family. You type or paste a narrative, such as the basic structure and any key relationships or health history you want to include, and the AI parses that text, places the correct symbols, draws the appropriate relationship lines, and arranges the layout automatically. The result is a fully editable diagram that you can refine, annotate, and export for clinical records or educational use. Try the AI genogram creator to generate your own genogram from a text description in seconds.
Genogram Symbols Used in This Example
The following standard genogram symbols appear in the School Counselor Genogram: Student in Two Households. Each symbol follows McGoldrick and Gerson clinical notation conventions.
Person Symbols
- Male (Square)
- A square represents a male family member.
- Female (Circle)
- A circle represents a female family member.
- Index person (highlighted outline)
- The person at the centre of the assessment is drawn with a highlighted outline.
- Deceased (X)
- An X through the symbol marks a person who has died; birth and death years are written above it.
- Age inside the symbol
- The current age (or age at death) is written inside each symbol, with years above it.
Couples
- Marriage
- A solid line between partners; the marriage year is written on the line (m 90 = married 1990).
- Divorce
- Two slashes across the couple line mark a divorce, with the year (d 02).
- Cohabitation
- A dashed couple line marks partners who live together without marrying.
- Immigration marker
- A double wavy mark on a person’s line records immigration; a single wavy mark records living across two cultures.
Children
- Parent-child line
- A vertical line from the couple line to each child; siblings run oldest to youngest from left to right.
- Step-parent line
- A step line connects a step-parent to a partner’s child.
- Household
- A boundary around the people who share a home, with the year it began (shown in the editor’s Households view).
Emotional Relationships
- Close
- Two parallel blue lines mark an emotionally close relationship.
- Conflict
- Dashed red double lines mark open conflict.
- Hostile
- A red zigzag marks a hostile relationship.
Medical
- Medical shading
- The left half of a symbol is shaded for a physical or mental illness and the bottom half for alcohol or drug use; each condition has its own colour, listed in the key. Hatching means suspected, a partial fill means in recovery.
Related Resources
- Read our guide to genograms for school counselors.
- See another blended family genogram.
- Learn about the divorce symbol.
- Use our list of genogram questions to ask in a student intake.
Frequently Asked Questions
Why would a school counselor use a genogram?
How are step-siblings and half-siblings shown?
How do you show which household a child lives in?
What is the presenting problem field?
Related Genogram Examples
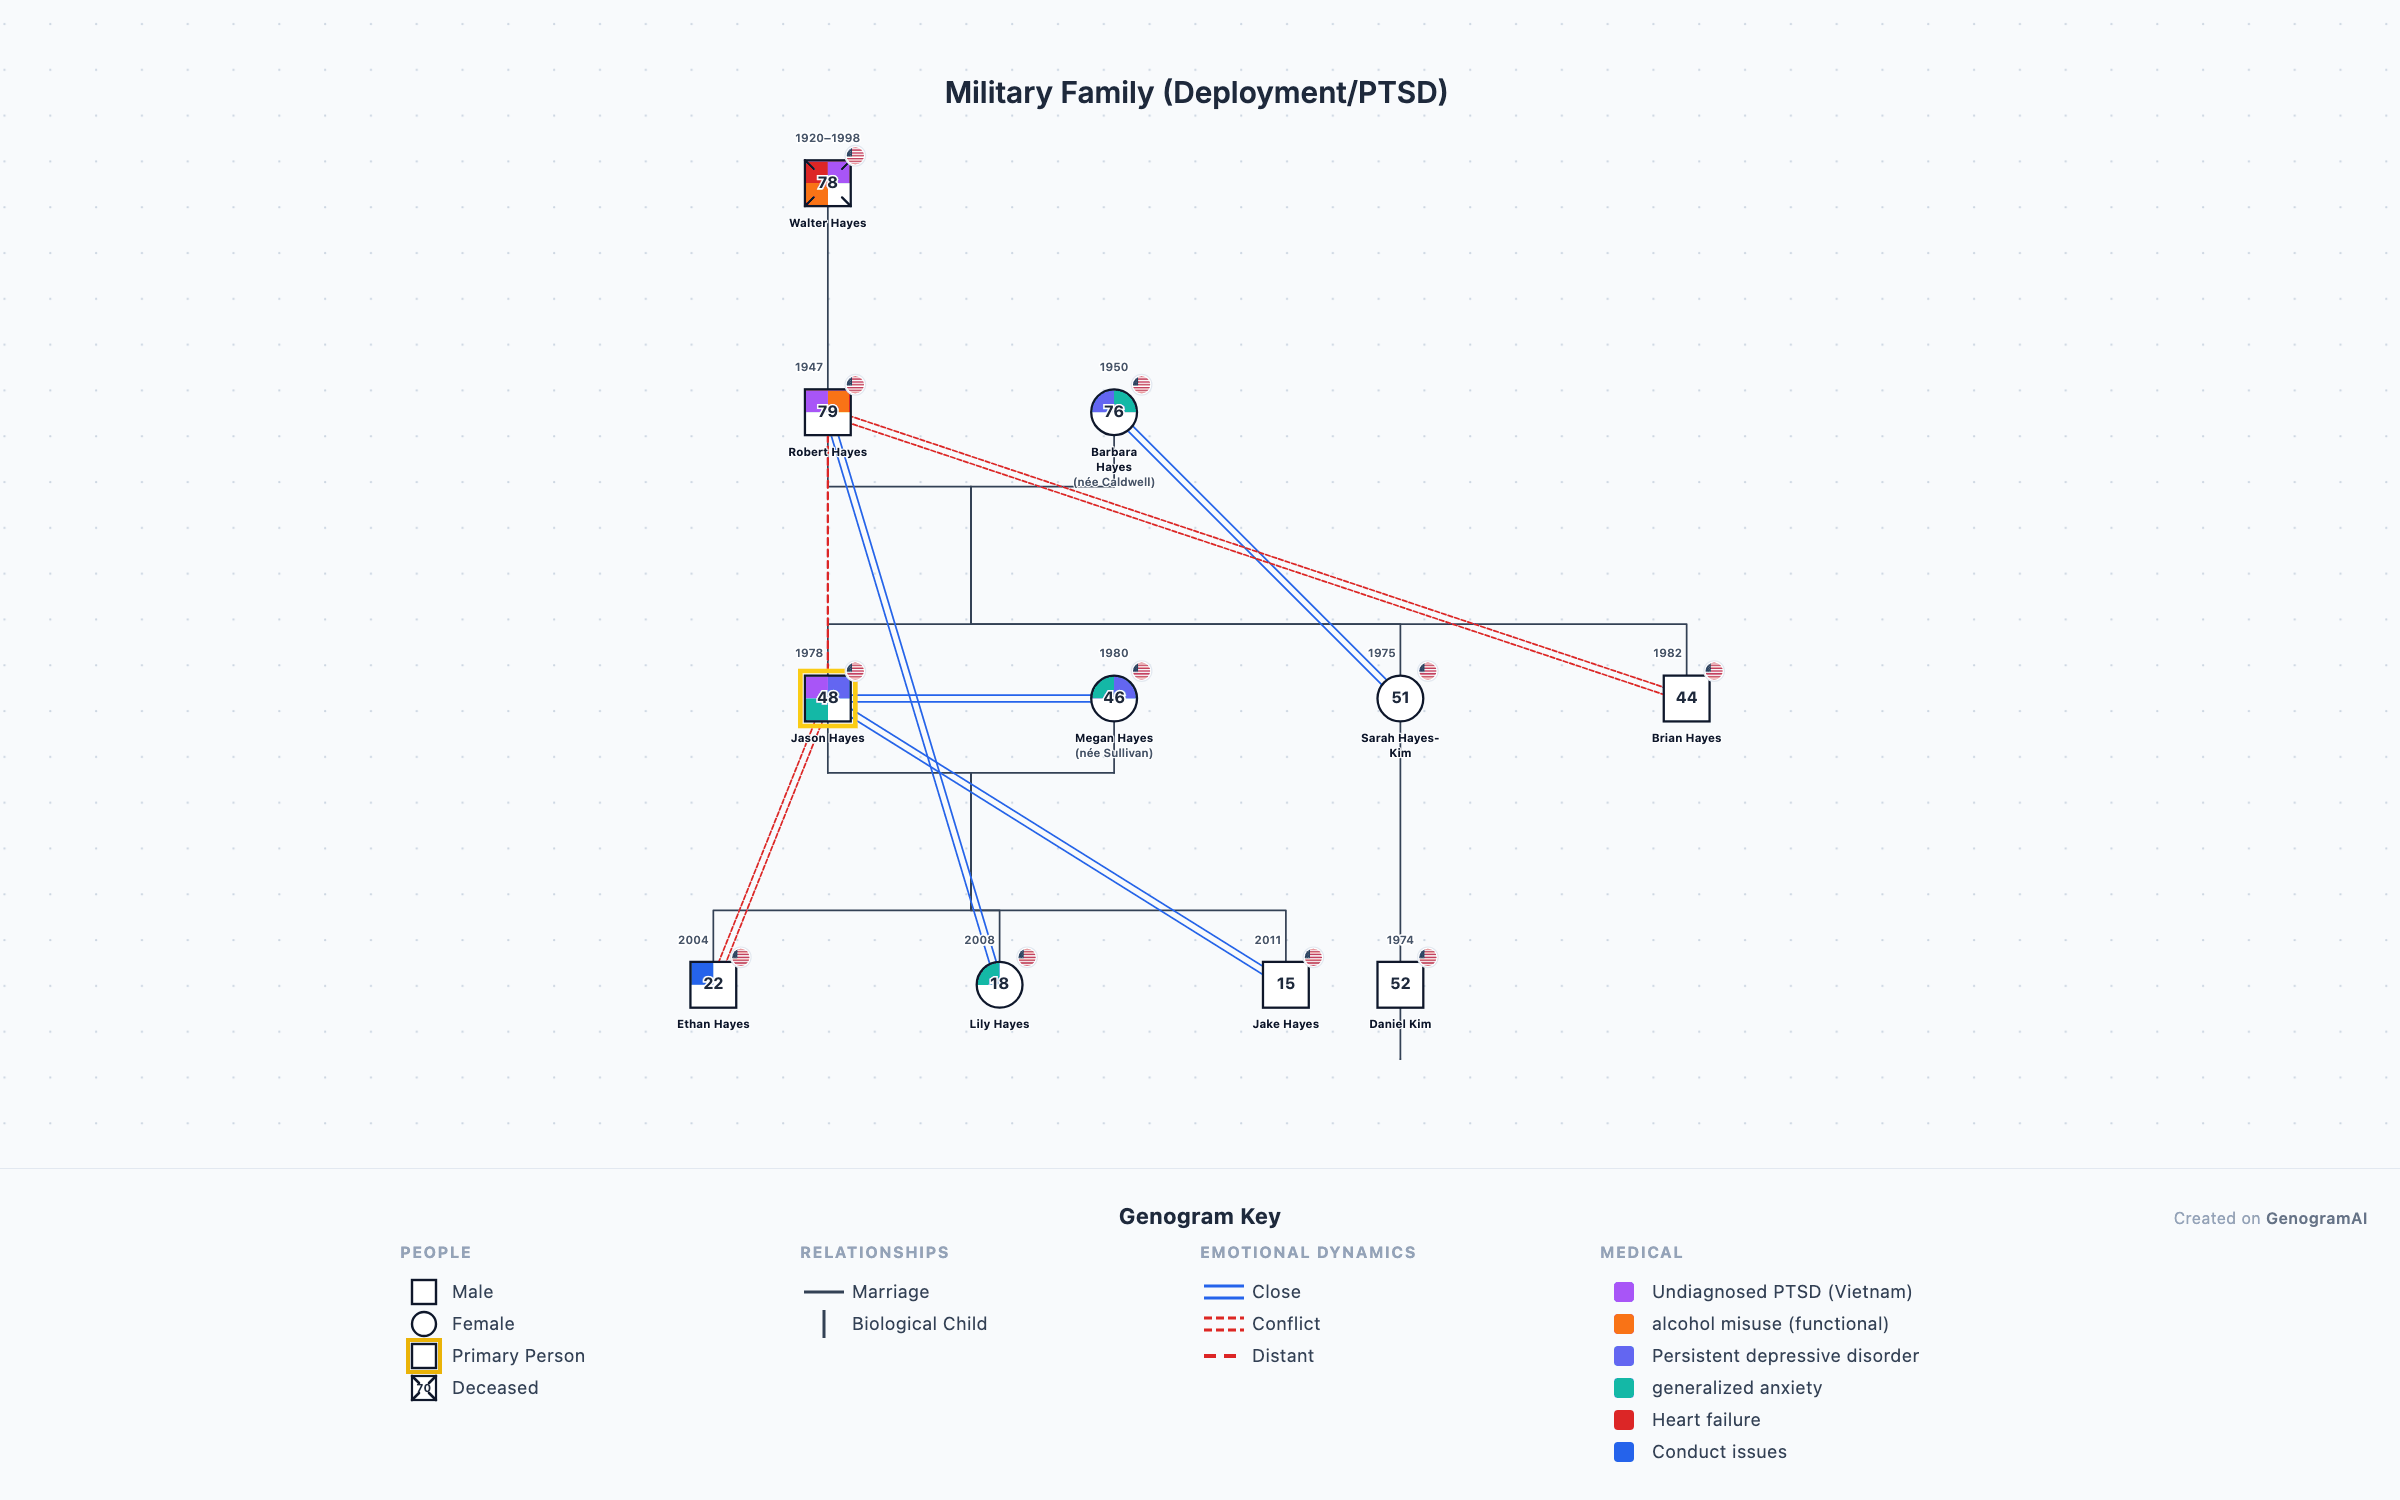
Military Family (Deployment/PTSD)
A multi-generational military family genogram illustrating the cumulative effects of combat deployment across three generations: Vietnam, Iraq, and Afghanistan.
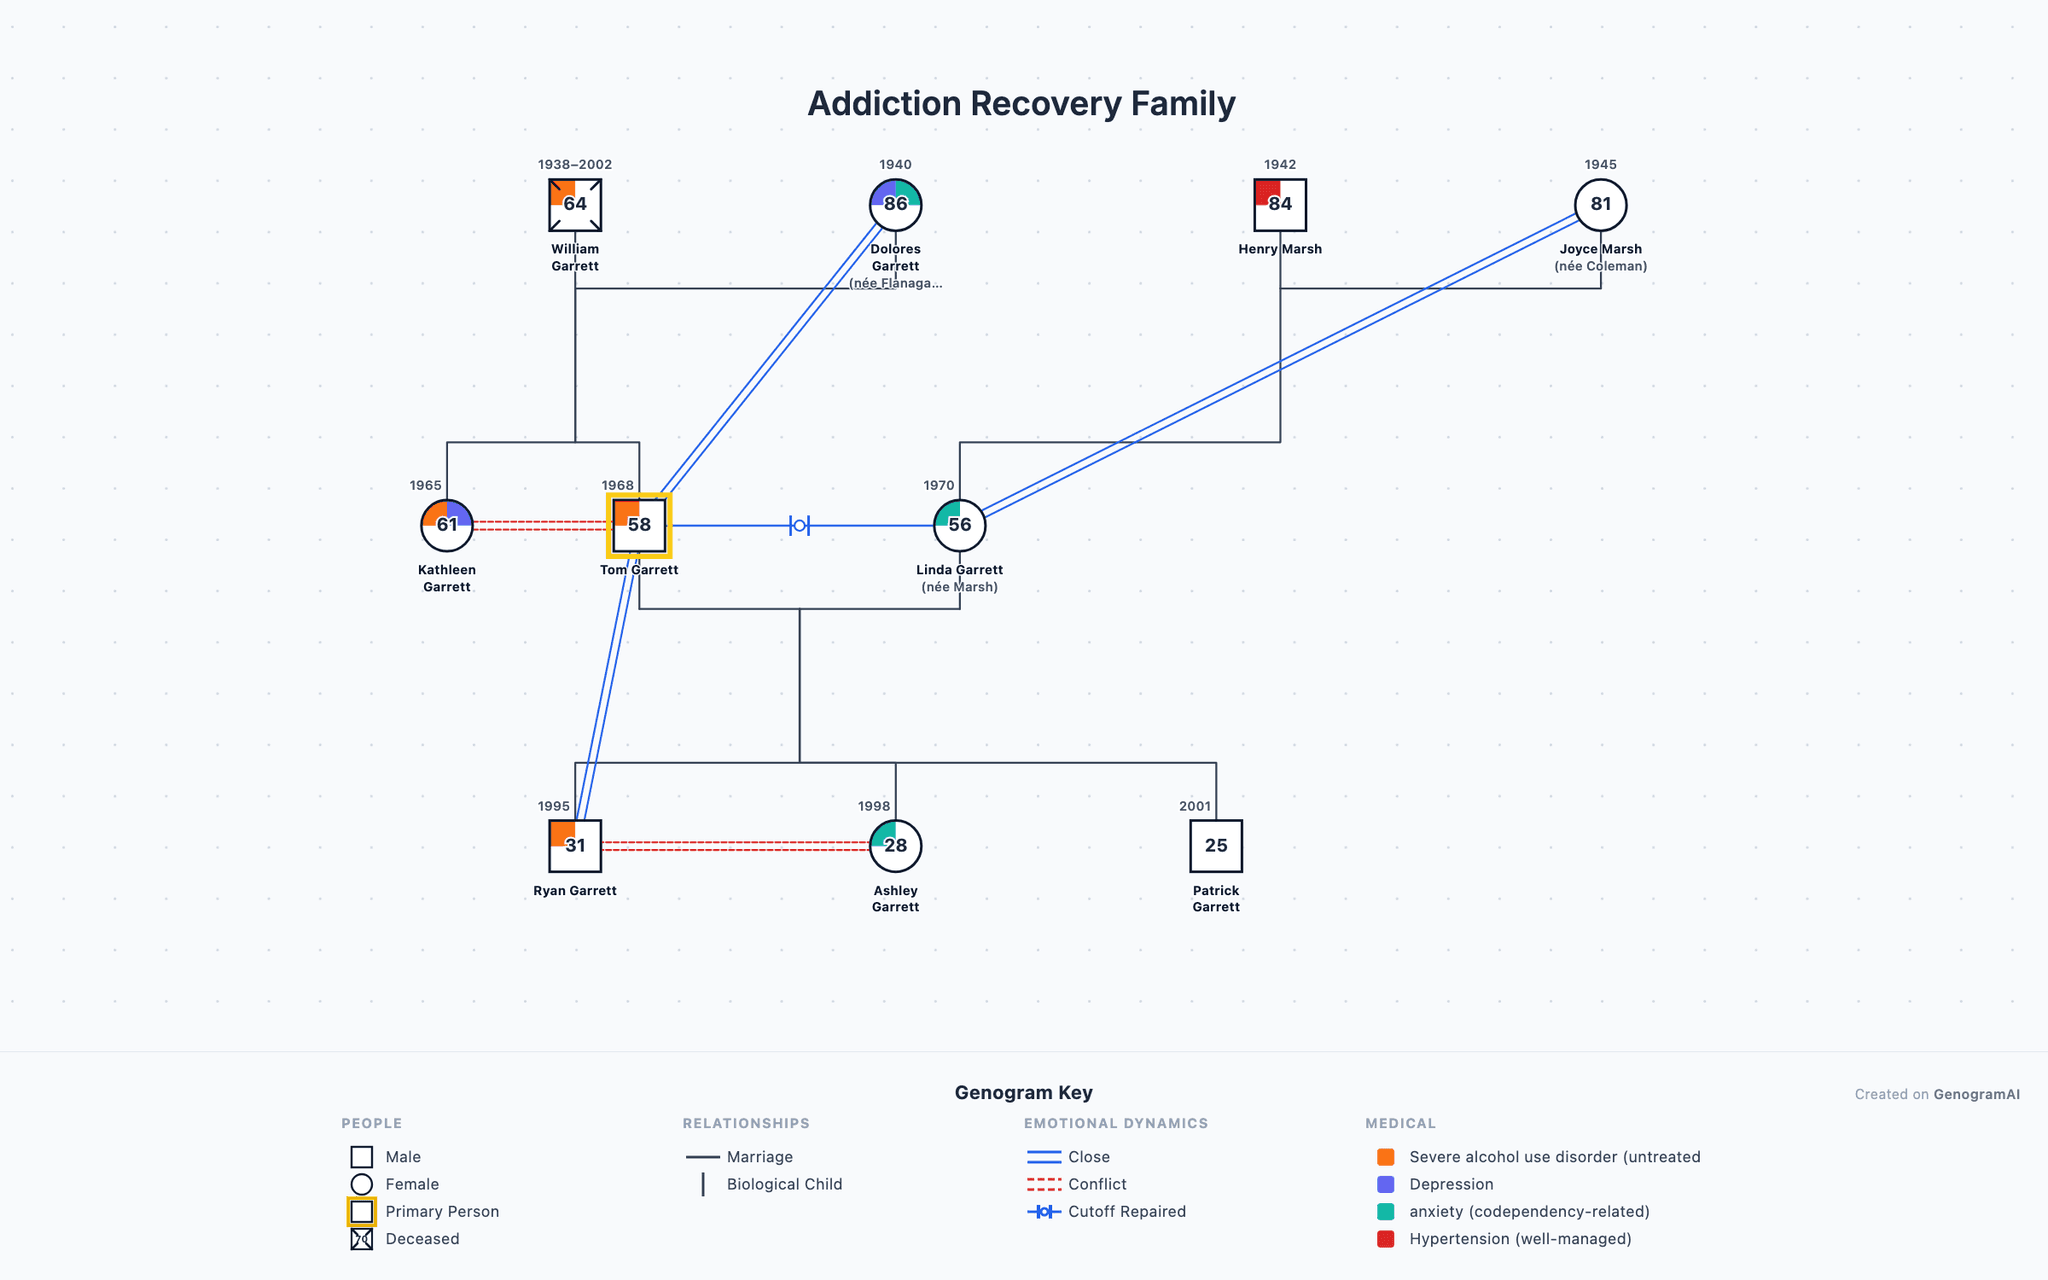
Addiction Recovery Family
A family genogram illustrating multiple generations of addiction and recovery, showing the full spectrum from active addiction to long-term sobriety.
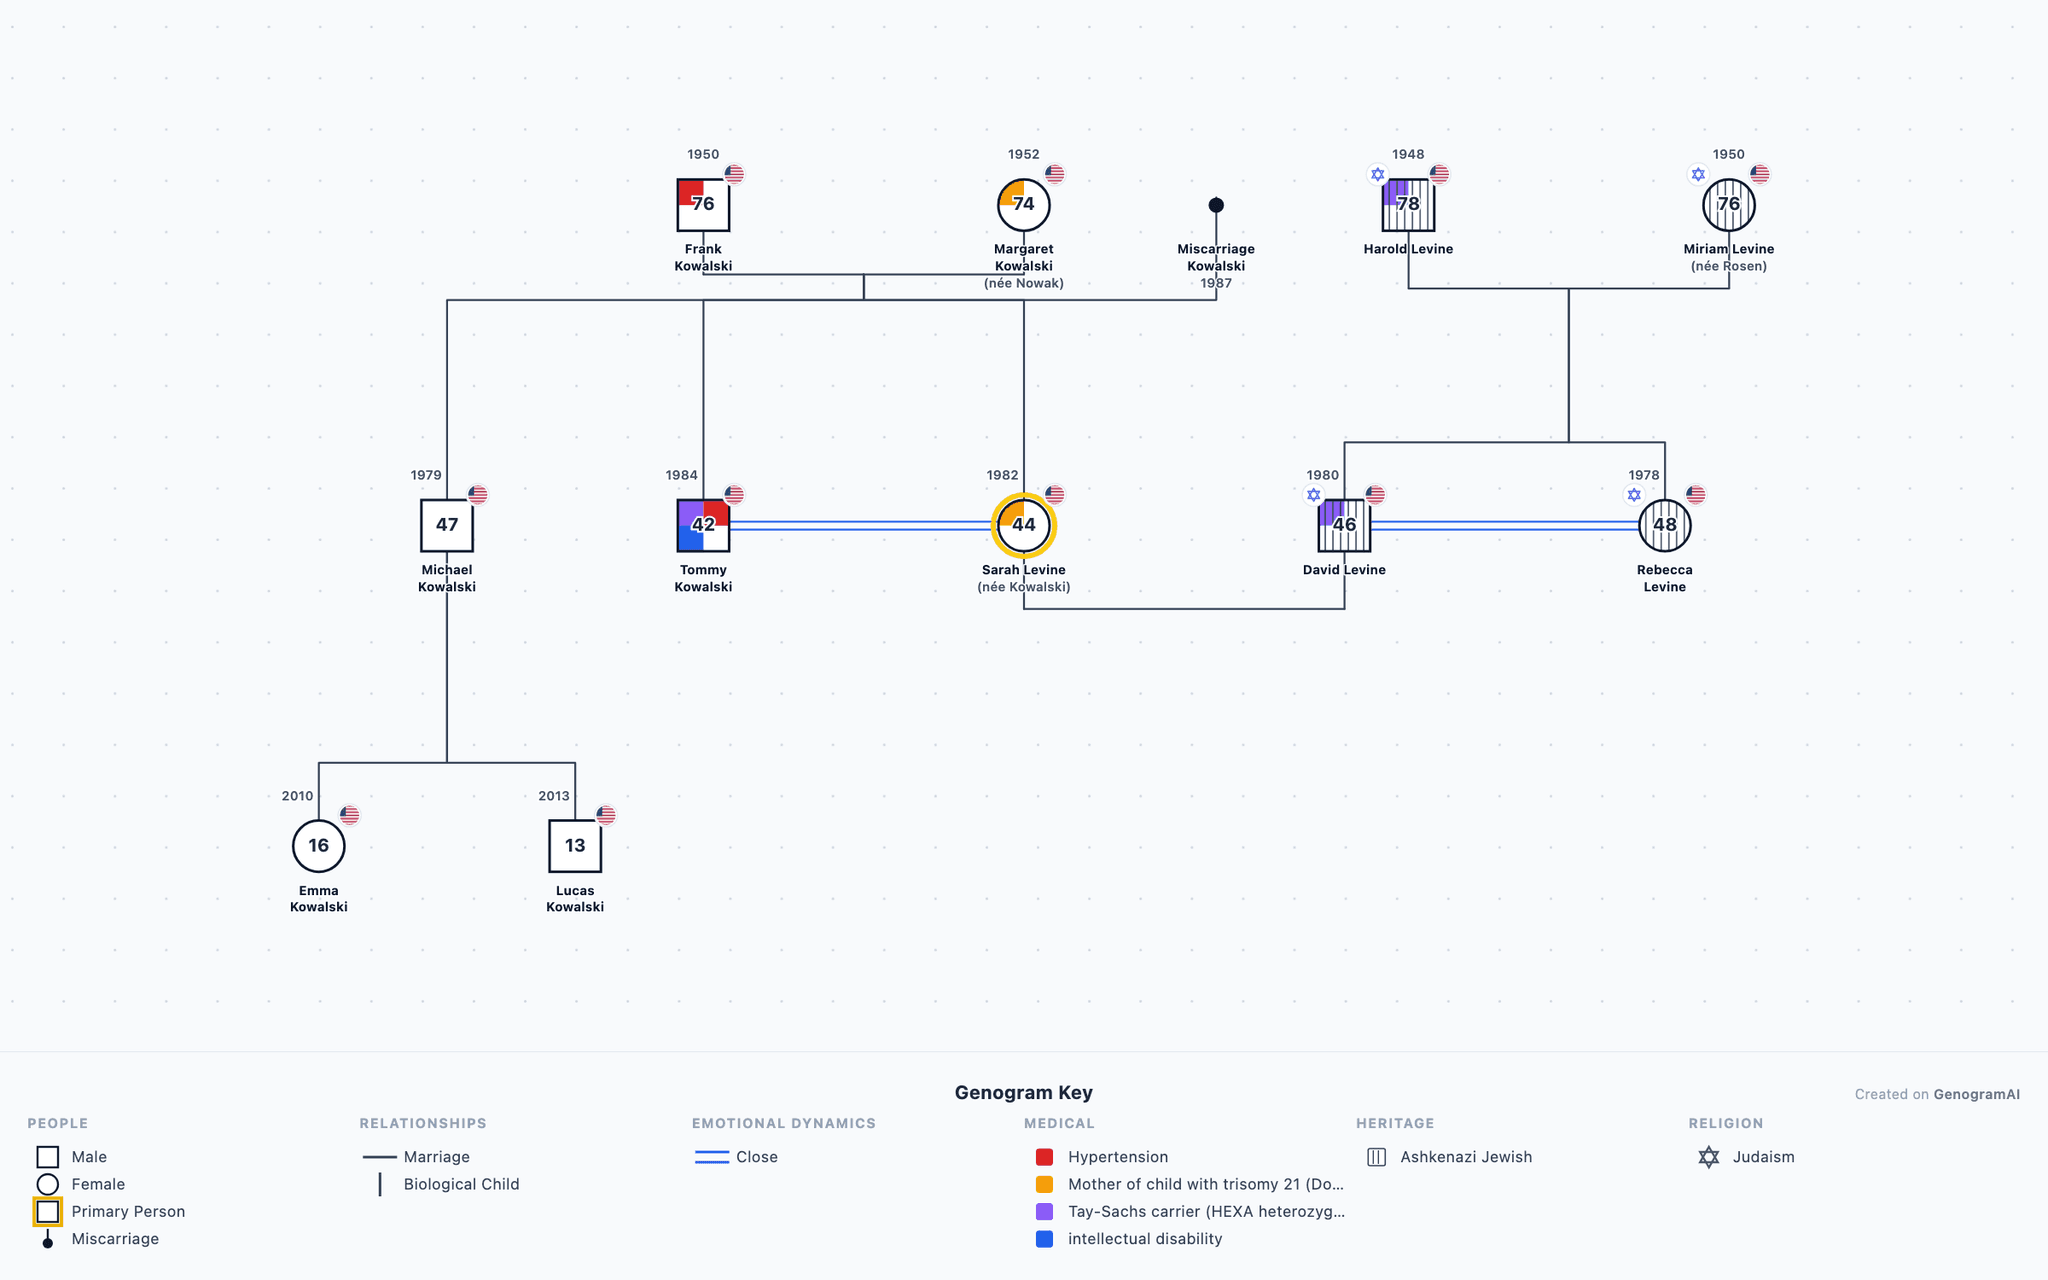
Genetic Counseling Genogram
A genetic counseling genogram for a couple seeking pre-conception genetic counseling.
Create Your Own Genogram
Use GenogramAI to build your own family genogram with AI assistance. Describe your family and let AI do the rest.
Educational disclaimer: This genogram example is an educational illustration of genogram notation and family systems concepts. Examples based on public figures use publicly available information. They are not clinical documents. All examples are intended for learning genogram symbols and patterns.