Genogram example · Famous contemporary families
Anderson Cooper Genogram
Quick answer
At a glance
| This example | |
|---|---|
| Generations | 4 |
| Family members | 9 (7 male, 2 female) |
| Birth years | 1794 to 2022 |
| Deceased | 6 |
| Index person | Wyatt Emory Cooper |
| Conditions marked | Mental Health Conditions |
| Category | Famous contemporary families |
| Tags | Famous Families, Entertainment, Educational |
About this genogram
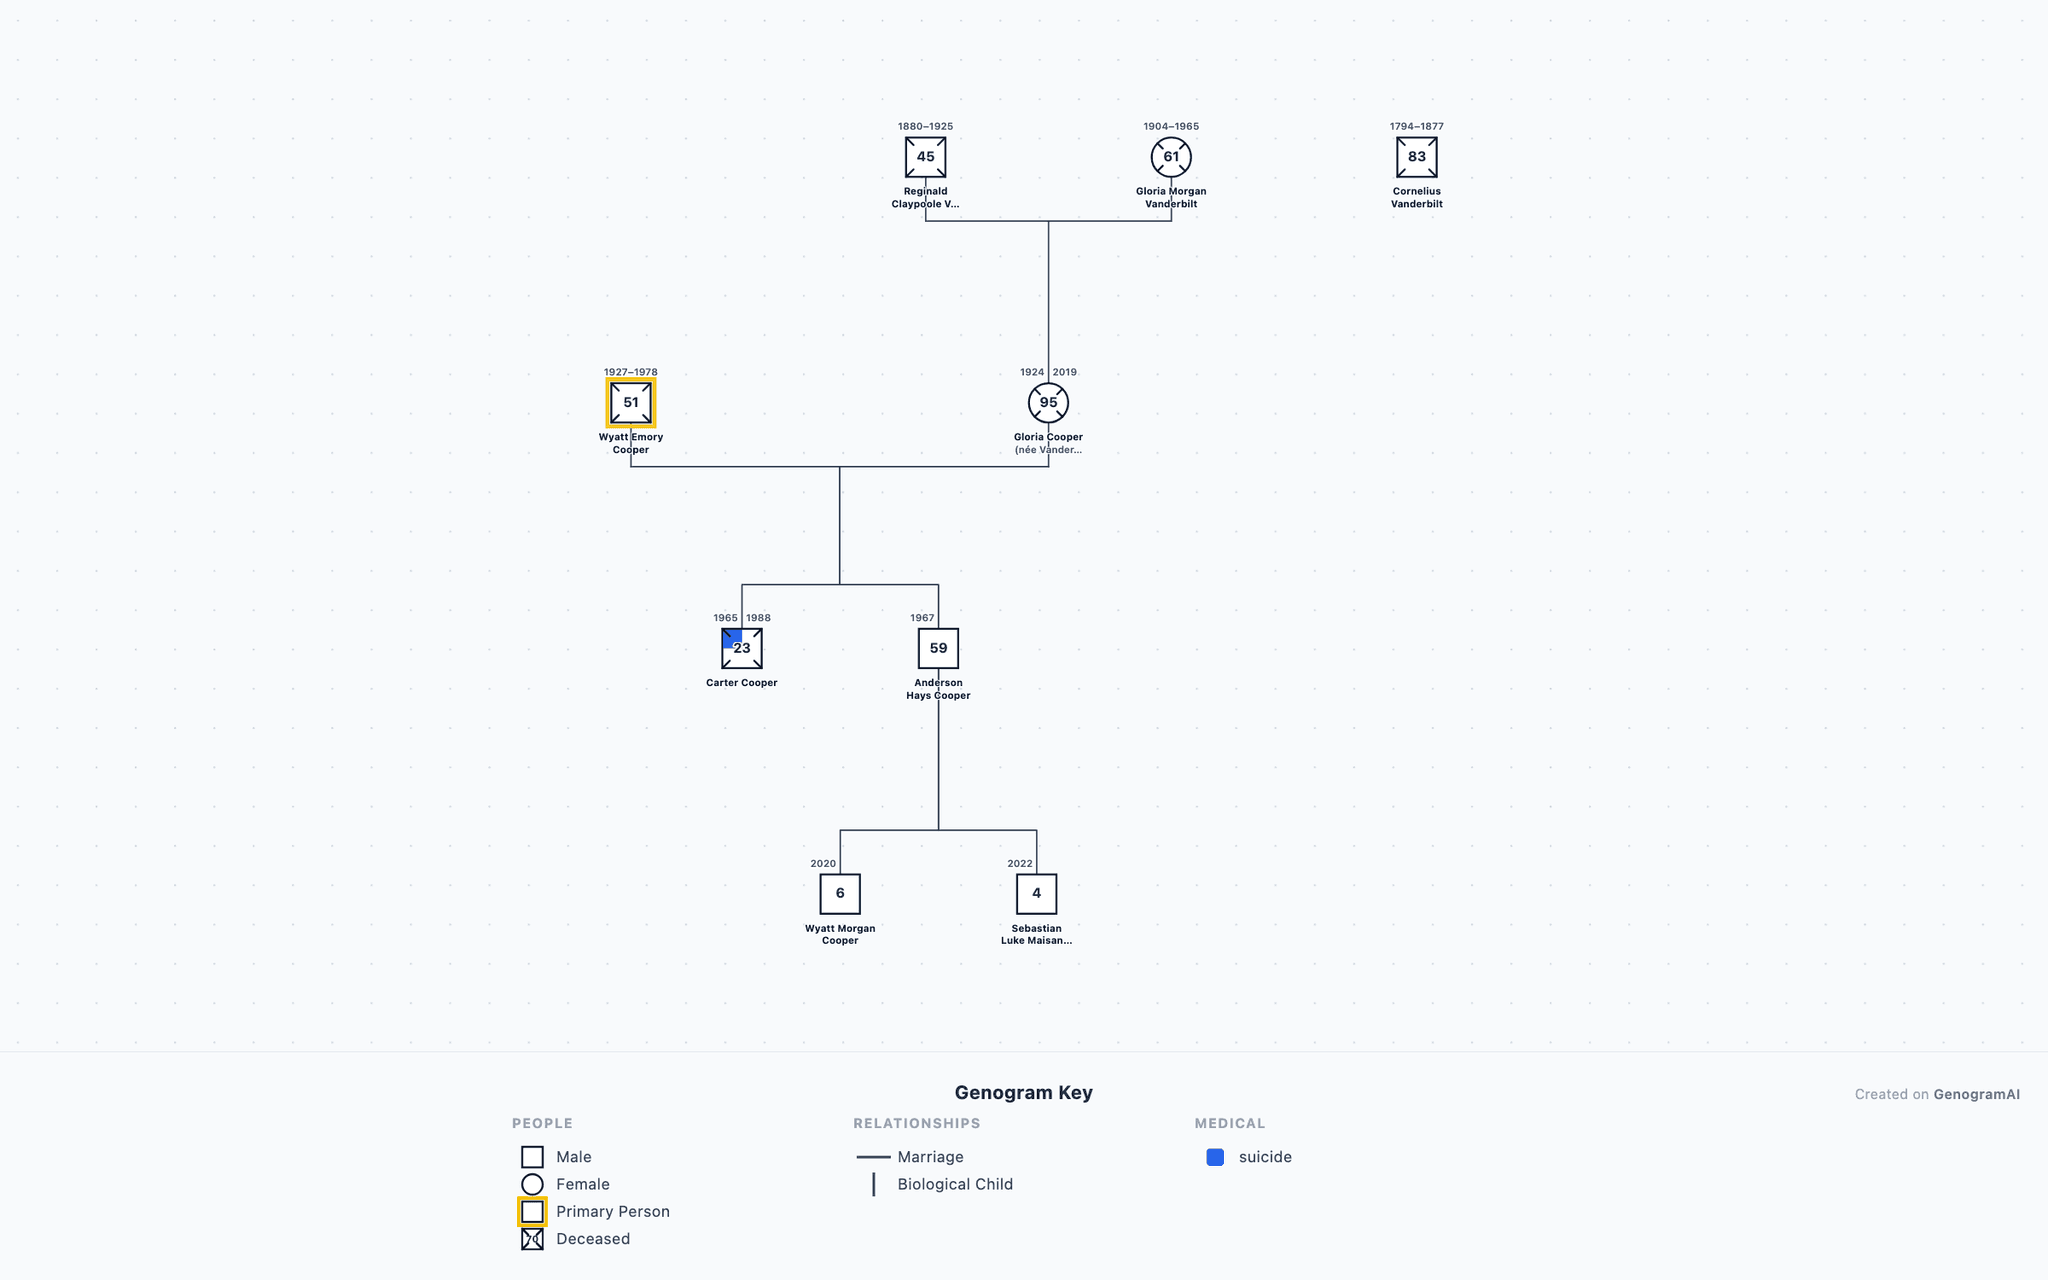
Anderson Cooper's family spans one of the greatest American fortunes and one of the most painful private tragedies in media history. His mother, Gloria Vanderbilt, was the great-great-granddaughter of railroad magnate Cornelius Vanderbilt, whose fortune once represented nearly one-tenth of the U.S. economy.
Family analysis
Overview
This 4-generation genogram maps 9 family members with birth years spanning from 1794 to 2022, comprising 7 males and 2 females (6 deceased). The genogram tracks 1 medical/psychological condition category. The index patient is Wyatt Emory Cooper (b. 1927), screenwriter, author.
The Anderson Cooper Genogram spans a remarkable historical period from 1794 to the present. Notable family members include Cornelius (railroad and shipping magnate), Gloria (artist, fashion designer, actress, author), Wyatt Emory (screenwriter, author), Anderson Hays (journalist, cnn anchor). The genogram records 6 deaths, including Carter (suicide at 23).
Health conditions
Medical and psychological conditions are documented in 1 of 9 family members (11%). Mental health conditions appears in 1 member (Carter).
Teaching use
As an educational tool, the Anderson Cooper Genogram provides an accessible entry point for learning genogram notation and interpretation. Because the family's history is publicly documented, students can verify relationship structures and practice reading genogram symbols against known facts. The example illustrates how even well-known families exhibit the universal dynamics of intergenerational transmission, loss, and adaptation that genograms are designed to capture.
How do you read the Anderson Cooper Genogram?
- 1
Find each person and generation
Squares are males and circles are females, and each row is one generation, oldest at the top. This one has 7 males and 2 females across 4 generations. - 2
Check the status markers
Markers on a symbol add facts about that person: Deceased (X) and Index Patient (Arrow). 6 people are marked deceased. The index person, the focus of the assessment, is Wyatt Emory Cooper. - 3
Follow the family lines
Horizontal lines join partners and vertical lines drop to their children, born left to right in birth order. This genogram uses Marriage and Parent-Child lines. - 4
Read the shading
Shaded symbols mark health conditions: Mental Health Conditions. Trace each line of descent to see where a condition recurs and where it stops.
Genogram symbols used in this example
| Symbol | Type | What it means |
|---|---|---|
| Male (Square) | Person Symbols | A square represents a male family member in standard genogram notation. |
| Female (Circle) | Person Symbols | A circle represents a female family member in standard genogram notation. |
| Deceased (X) | Status Markers | An X drawn through the symbol indicates the person is deceased. |
| Index Patient (Arrow) | Status Markers | An arrow pointing to a person identifies them as the index patient — the individual who is the focus of the clinical assessment. |
| Marriage | Structural Relationships | A solid horizontal line connecting two individuals represents a marriage or committed partnership. |
| Parent-Child | Structural Relationships | A vertical line descending from a couple line to a child symbol represents a parent-child relationship. |
| Mental Health Conditions | Medical Conditions | Shading indicates psychological or psychiatric conditions beyond anxiety and depression. |
Build a genogram like this one
Example prompt
- 1
Start from the dashboard
Sign in to GenogramAI and choose Create with AI (paid plans), or open a blank genogram and use Ask AI (any plan). To start from this exact chart instead, use Open as template. - 2
Describe your family
Paste a description like the one above, with your own names, dates, relationships and health history. - 3
Check and adjust
Edit people and lines by hand, or ask the AI for one change at a time. - 4
Export
Download a PNG on the free plan. PDF and SVG export are on paid plans.
The free plan includes 2 genograms and 5 AI credits a month. See the AI genogram creator for what else it can do.
Related resources
- New to genograms? Start with our guide on how to read a genogram to understand the symbols used here.
- Reference our complete genogram symbols guide to decode the notation in this example.
- Learn what a genogram is and why family therapists use them to map multigenerational patterns.
- The deceased symbol (X through the shape) marks family members who have passed away.
- The marriage symbol connects partnered individuals in this genogram.
Frequently asked questions
What clinical patterns does the Anderson Cooper Genogram reveal?
The Anderson Cooper Genogram maps multigenerational transmission of psychological patterns, emotional dynamics, and relationship structures. Clinicians use it to identify recurring cycles of behavior, attachment styles, and communication patterns that may inform diagnosis and treatment planning in family therapy.
Why use Anderson Cooper as a genogram example?
Anderson Cooper provides an excellent genogram learning example because the family relationships are already well-known. Students and professionals can focus on understanding genogram symbols and notation rather than memorizing new family information.
What genogram symbols are used in the Anderson Cooper Genogram example?
This genogram uses Male (Square), Female (Circle), Deceased (X), Index Patient (Arrow), Marriage, Parent-Child and Mental Health Conditions. All of them follow standard genogram notation, so the chart reads the same way in any genogram program or textbook.
Can I build a genogram like the Anderson Cooper Genogram example?
Yes. Open GenogramAI, choose Create with AI on the dashboard (paid plans) or open a blank genogram and use Ask AI in the editor (any plan), and describe the family in plain words: who is in it, how they are related, key dates and the relationships or health conditions you want to show. The AI draws the symbols and lines, and you can then edit by hand or ask for one change at a time. A family of 9 people like this one takes a short paragraph to describe. The free plan includes 2 genograms and 5 AI credits a month, with PNG export.
About this example