Genogram example · Clinical & therapeutic
PTSD and Trauma Transmission
Quick answer
At a glance
| This example | |
|---|---|
| Generations | 3 |
| Family members | 11 (5 male, 6 female) |
| Birth years | 1942 to 2003 |
| Deceased | 1 |
| Index person | Tyler Hawkins |
| Emotional relationships | Close, Distant, Conflict and Abuse/Violence |
| Conditions marked | Anxiety Conditions, Depressive Disorders, Mental Health Conditions and Trauma/PTSD |
| Category | Clinical & therapeutic |
| Tags | Clinical, Medical, Educational |
About this genogram
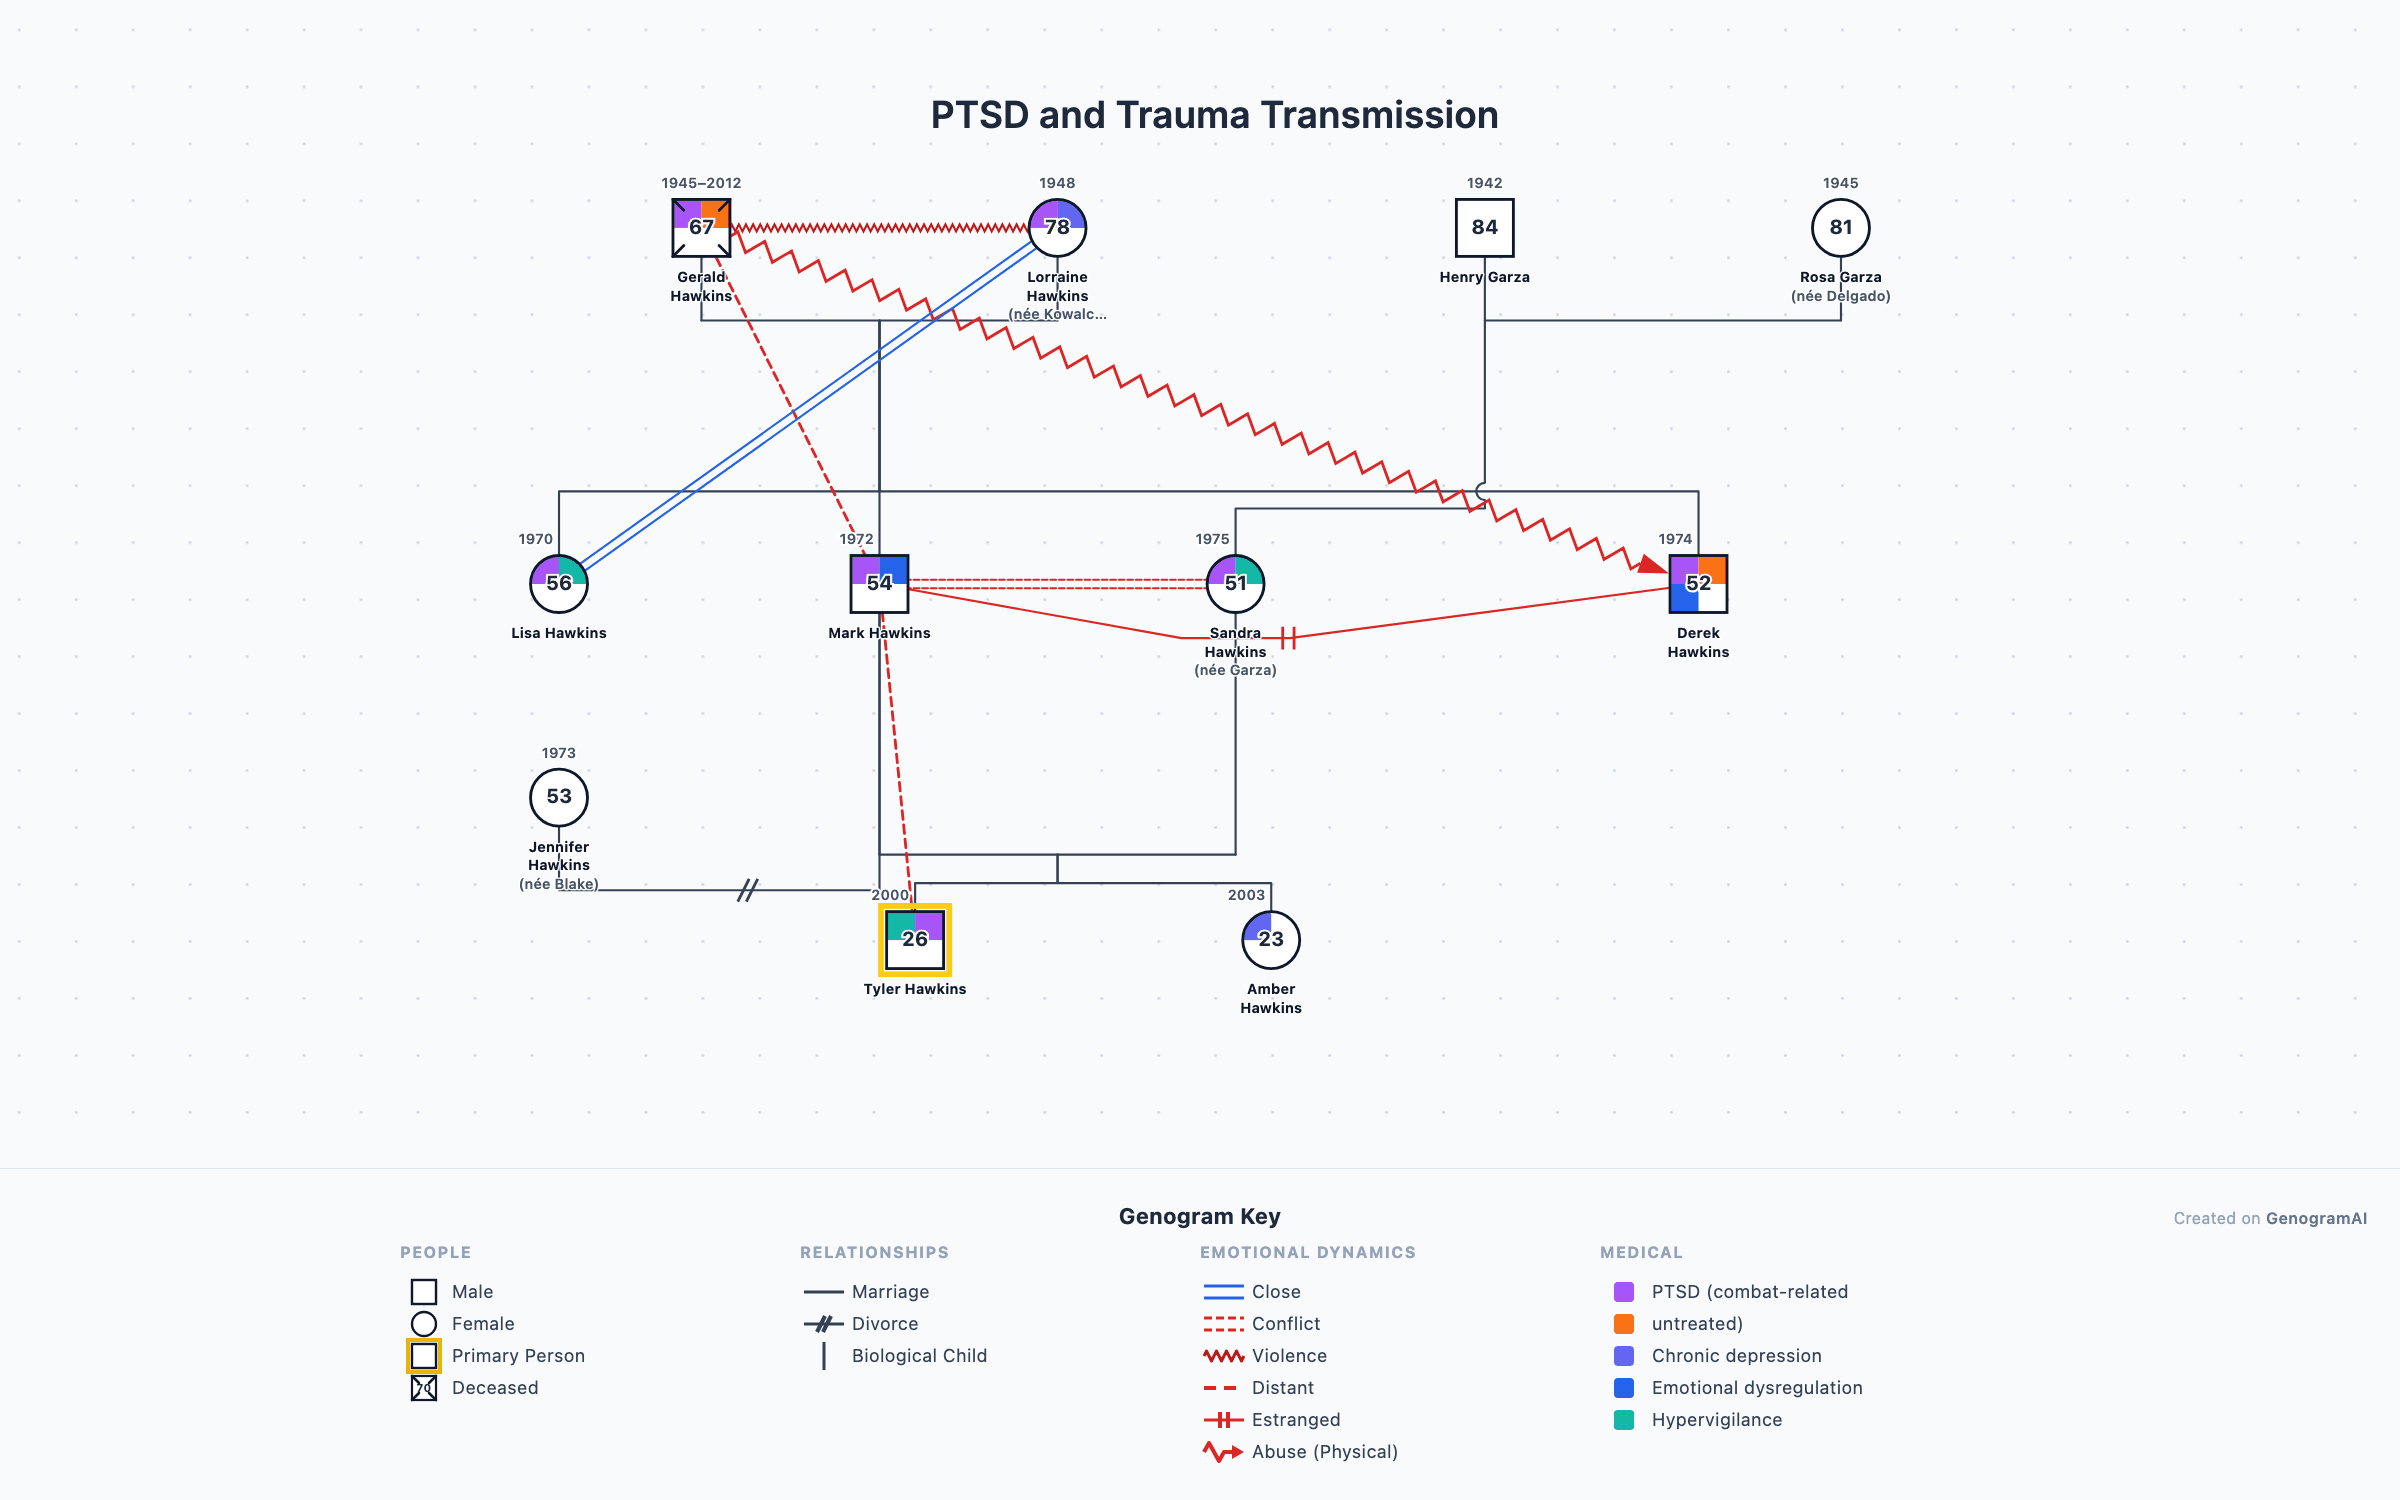
A three-generation genogram illustrating intergenerational trauma transmission from a Vietnam War veteran through domestic violence, complex PTSD, and hypervigilance. Demonstrates how unresolved trauma propagates through family systems via abuse, emotional neglect, and maladaptive coping.
Clinical analysis
Overview
This 3-generation genogram maps 11 family members with birth years spanning from 1942 to 2003, comprising 5 males and 6 females (1 deceased). The genogram tracks 5 medical/psychological condition categories and 6 emotional relationship types across 7 documented dyads. The index patient is Tyler Hawkins (b. 2000), community college student / part-time retail.
Generation by generation
The family system encompasses 3 generations with distinct patterns at each level. The oldest generation includes Gerald, Lorraine, Henry and 1 other, with 2 presenting documented conditions. The middle generation includes Mark, Sandra, Lisa and 1 other, with 4 presenting documented conditions. The youngest generation includes Tyler, Amber, Jennifer, with 2 presenting documented conditions.
Emotional relationships
Emotional relationship mapping reveals 1 abusive relationship, 1 abuse_physical relationship, 1 estranged relationship, 2 distant relationships, 1 close relationship, 1 conflictual relationship. Specific patterns include a abusive relationship between Gerald and Lorraine, a abuse_physical relationship between Gerald and Derek, a estranged relationship between Derek and Mark. Conflictual patterns highlight areas of tension that may benefit from therapeutic intervention and improved communication strategies.
Health conditions
Medical and psychological conditions are documented in 8 of 11 family members (73%). Trauma-related conditions appear in 7 members (Gerald, Lorraine, Mark...), affecting 3 females and 4 males. Anxiety-spectrum conditions appear in 3 members (Sandra, Lisa, Tyler), affecting 2 females and 1 male. Substance appear in 2 members (Gerald, Derek). Comorbidity is observed in 7 family members, with Gerald presenting 2 concurrent condition categories. The multigenerational prevalence of trauma-related conditions suggests both genetic predisposition and possible environmental or behavioral transmission pathways.
Clinical perspective
From a clinical perspective, this genogram offers rich material for therapeutic exploration. The presenting concerns of Tyler Hawkins can be contextualized within 3 generations of family patterns. Bowen family systems theory would note the intergenerational transmission of both symptomatic presentations and relational patterns. This case is particularly suited for exploring differentiation of self, family projection processes, and the way anxiety moves through the family emotional system.
How do you read the PTSD and Trauma Transmission genogram?
- 1
Find each person and generation
Squares are males and circles are females, and each row is one generation, oldest at the top. This one has 5 males and 6 females across 3 generations. - 2
Check the status markers
Markers on a symbol add facts about that person: Deceased (X) and Index Patient (Arrow). 1 person is marked deceased. The index person, the focus of the assessment, is Tyler Hawkins. - 3
Follow the family lines
Horizontal lines join partners and vertical lines drop to their children, born left to right in birth order. This genogram uses Marriage, Divorce and Parent-Child lines. - 4
Read the emotional lines
Lines drawn between two people show how they relate: Close, Distant, Conflict and Abuse/Violence. Notice who has several lines converging on them, and which patterns repeat from one generation to the next. - 5
Read the shading
Shaded symbols mark health conditions: Anxiety Conditions, Depressive Disorders, Mental Health Conditions and Trauma/PTSD. Trace each line of descent to see where a condition recurs and where it stops.
Genogram symbols used in this example
| Symbol | Type | What it means |
|---|---|---|
| Male (Square) | Person Symbols | A square represents a male family member in standard genogram notation. |
| Female (Circle) | Person Symbols | A circle represents a female family member in standard genogram notation. |
| Deceased (X) | Status Markers | An X drawn through the symbol indicates the person is deceased. |
| Index Patient (Arrow) | Status Markers | An arrow pointing to a person identifies them as the index patient — the individual who is the focus of the clinical assessment. |
| Marriage | Structural Relationships | A solid horizontal line connecting two individuals represents a marriage or committed partnership. |
| Divorce | Structural Relationships | A marriage line with two diagonal slashes indicates divorce or legal separation. |
| Parent-Child | Structural Relationships | A vertical line descending from a couple line to a child symbol represents a parent-child relationship. |
| Close | Emotional Relationships | Two parallel lines between individuals represent an emotionally close relationship. |
| Distant | Emotional Relationships | A dotted line represents an emotionally distant or disengaged relationship. |
| Conflict | Emotional Relationships | A zigzag line between individuals represents an openly conflictual relationship. |
| Abuse/Violence | Emotional Relationships | A zigzag line with a directional arrow and bold marks indicates physical abuse or domestic violence. |
| Anxiety Conditions | Medical Conditions | Shading in the genogram symbol indicates anxiety-spectrum diagnoses (GAD, panic disorder, phobias, OCD). |
| Depressive Disorders | Medical Conditions | Shading indicates depressive conditions (major depression, dysthymia, bipolar disorder). |
| Mental Health Conditions | Medical Conditions | Shading indicates psychological or psychiatric conditions beyond anxiety and depression. |
| Trauma/PTSD | Medical Conditions | Shading indicates post-traumatic stress disorder or complex trauma responses. |
Build a genogram like this one
Example prompt
- 1
Start from the dashboard
Sign in to GenogramAI and choose Create with AI (paid plans), or open a blank genogram and use Ask AI (any plan). To start from this exact chart instead, use Open as template. - 2
Describe your family
Paste a description like the one above, with your own names, dates, relationships and health history. - 3
Check and adjust
Edit people and lines by hand, or ask the AI for one change at a time. - 4
Export
Download a PNG on the free plan. PDF and SVG export are on paid plans.
The free plan includes 2 genograms and 5 AI credits a month. See the AI genogram creator for what else it can do.
Related resources
- Learn more about how genograms in family therapy sessions use multigenerational mapping like this example.
- This example illustrates concepts from Bowen family systems theory including intergenerational transmission.
- Explore how attachment theory genograms map relational bonds across generations.
- The violence relationship symbol denotes abuse or domestic violence in this family.
- The distant relationship symbol in this genogram indicates emotional disengagement.
Frequently asked questions
What clinical patterns does the PTSD and Trauma Transmission genogram reveal?
The PTSD and Trauma Transmission genogram maps multigenerational transmission of psychological patterns, emotional dynamics, and relationship structures. Clinicians use it to identify recurring cycles of behavior, attachment styles, and communication patterns that may inform diagnosis and treatment planning in family therapy.
How do therapists use the PTSD and Trauma Transmission genogram in sessions?
In clinical practice, the PTSD and Trauma Transmission genogram serves as both an assessment and intervention tool. Therapists use it to externalize family patterns, help clients visualize inherited dynamics, identify triangulation and enmeshment, and develop insight into how past generations influence present-day functioning and relationships.
What genogram symbols are used in the PTSD and Trauma Transmission example?
This genogram uses Male (Square), Female (Circle), Deceased (X), Index Patient (Arrow), Marriage, Divorce, Parent-Child, Close, Distant, Conflict, Abuse/Violence, Anxiety Conditions and 3 more. All of them follow standard genogram notation, so the chart reads the same way in any genogram program or textbook.
Can I build a genogram like the PTSD and Trauma Transmission example?
Yes. Open GenogramAI, choose Create with AI on the dashboard (paid plans) or open a blank genogram and use Ask AI in the editor (any plan), and describe the family in plain words: who is in it, how they are related, key dates and the relationships or health conditions you want to show. The AI draws the symbols and lines, and you can then edit by hand or ask for one change at a time. A family of 11 people like this one takes a short paragraph to describe. The free plan includes 2 genograms and 5 AI credits a month, with PNG export.
About this example