Genogram Basics
Location tracking: visualizing family migration patterns
Quick answer
Geography shapes families. Where people live, where they came from, and where they moved to all influence family dynamics, cultural identity, and generational patterns. GenogramAI’s location features help practitioners visualize these geographic dimensions of family history.
Why does location matter in a genogram?
Clinical significance
- Immigration and acculturation stress
- Geographic distance affecting family connections
- Regional cultural influences on family patterns
- Access to support networks and resources
- Historical context (wars, economic conditions)
- Refugee and displacement experiences
Using Location View
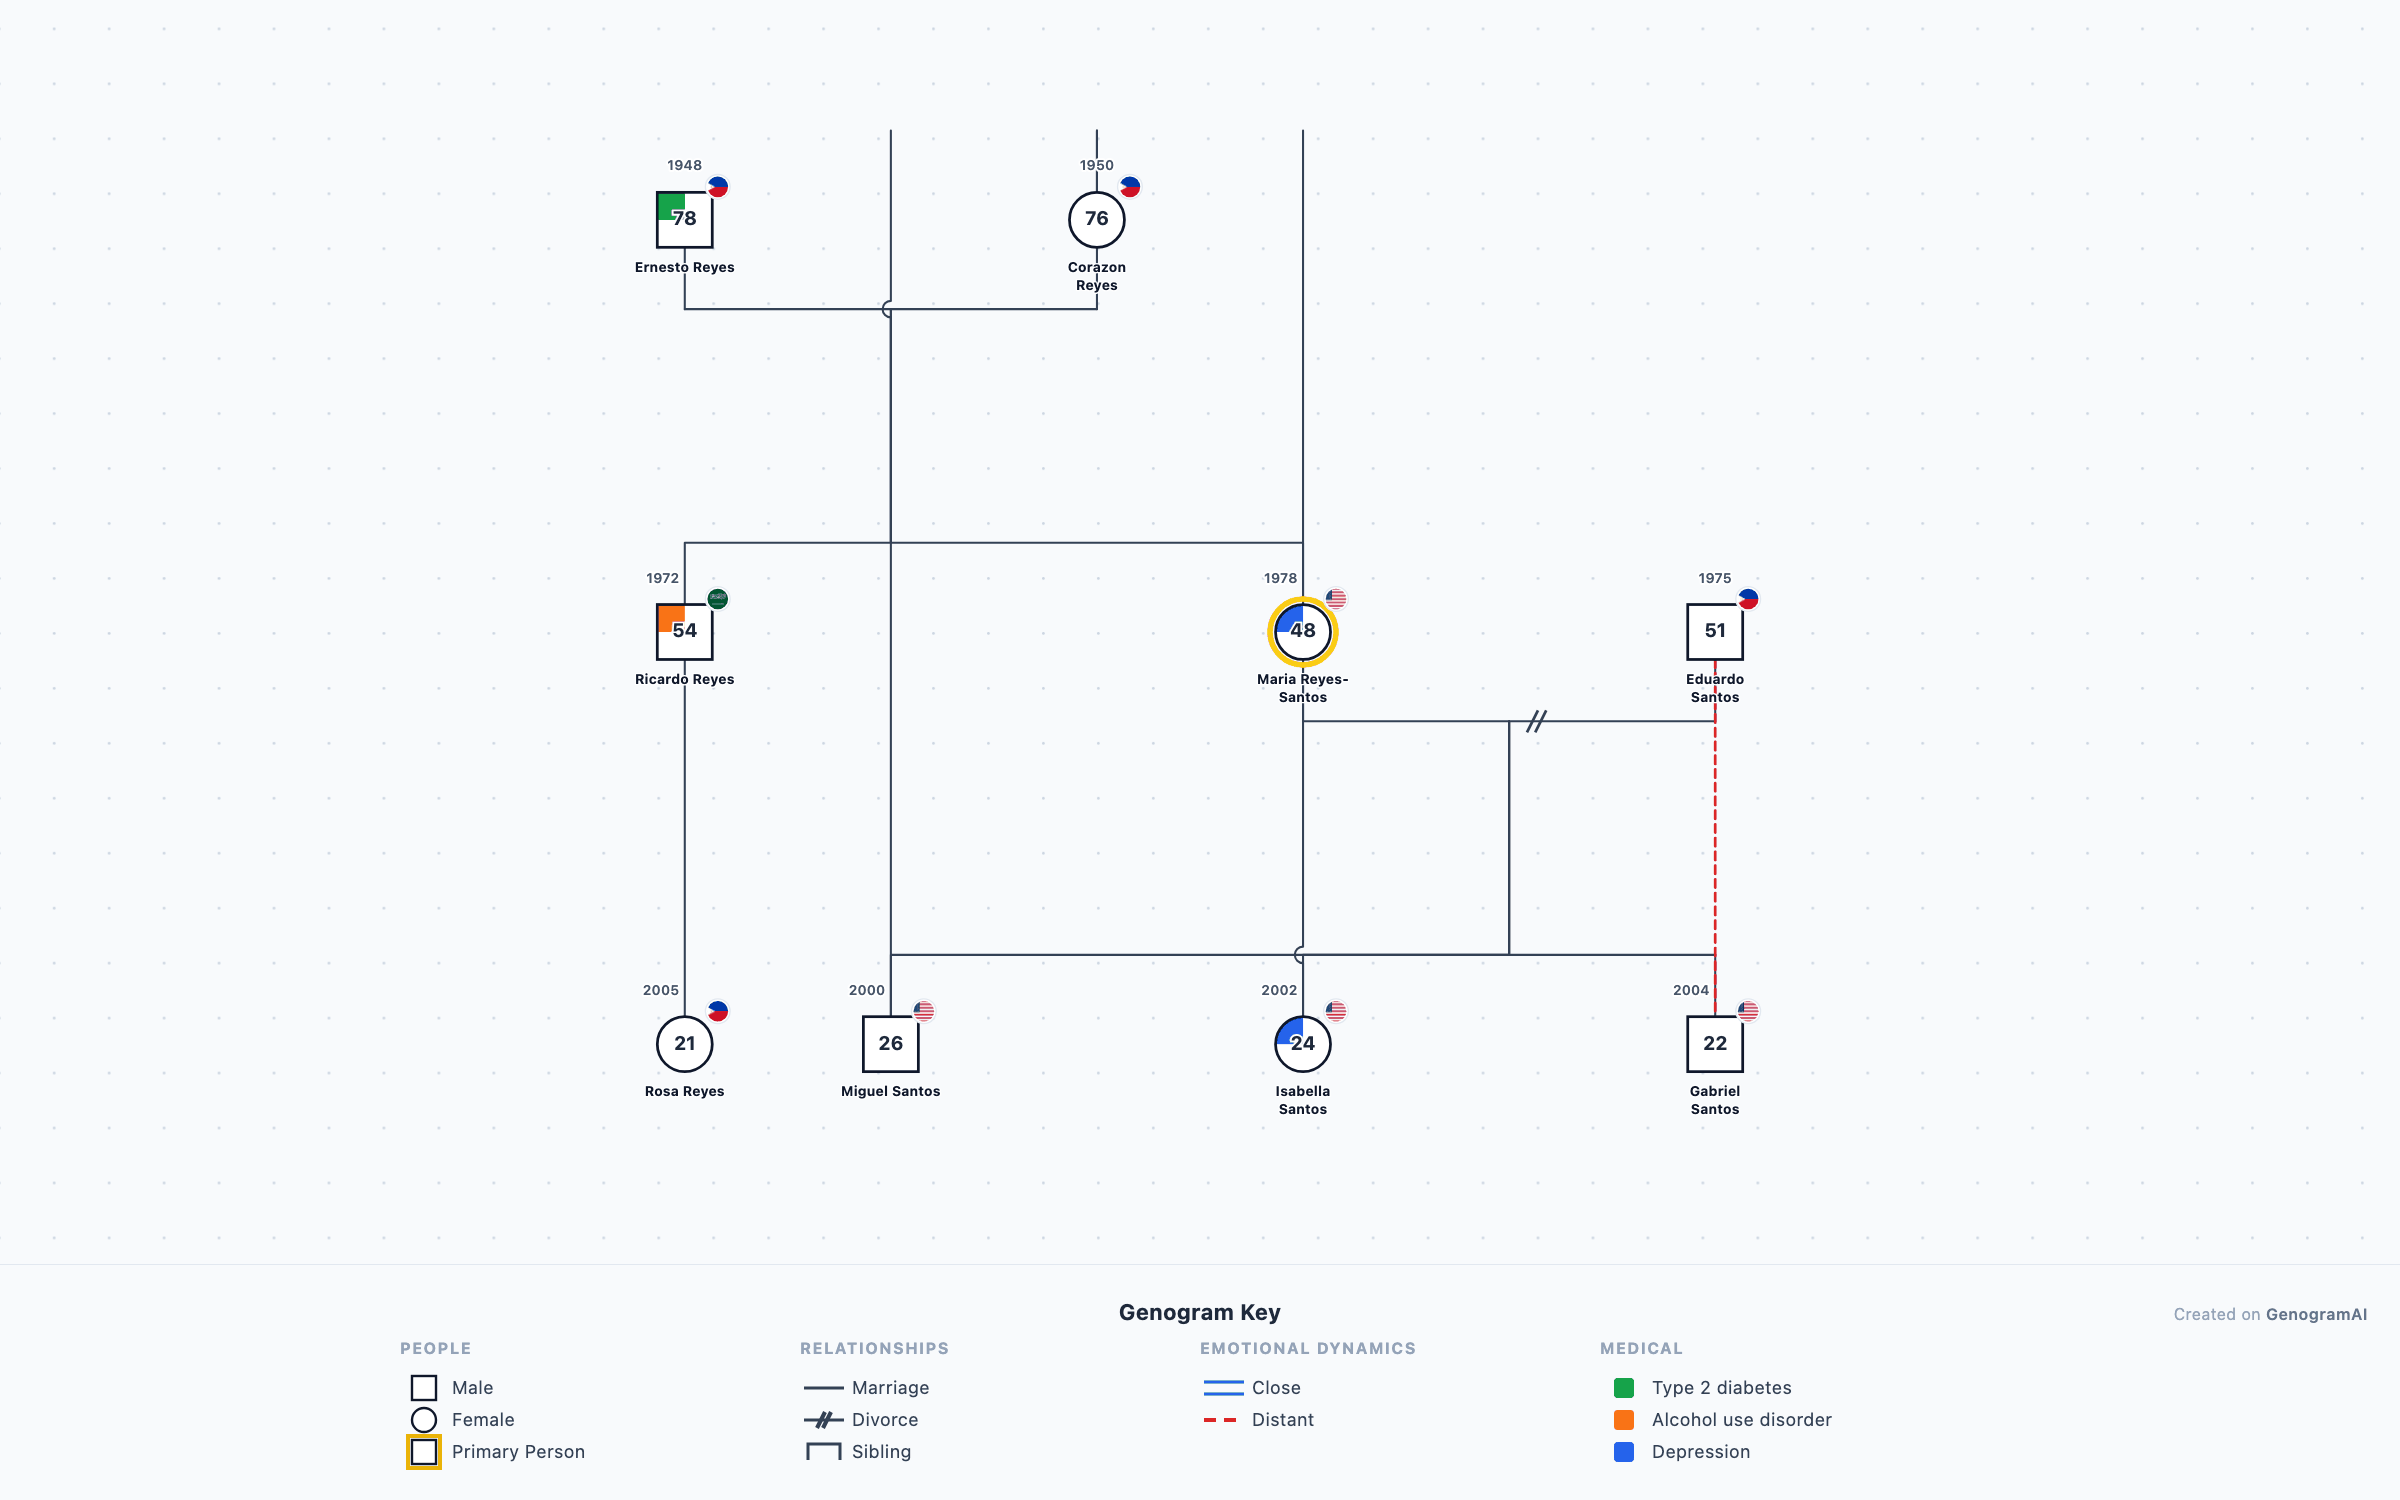
GenogramAI’s Location View mode overlays geographic information onto your genogram. When activated, each person shows their location label and optional country flag.
Adding location data
- 1
Select a person on the canvas
Selecting a person opens their details in the Inspector panel. - 2
Open the Location section
The Location section in the Inspector also has the switch that turns Location View on and off. - 3
Enter the place
Enter city, state/province, and/or country for where the person lives, and their birthplace if known. - 4
Pick the country for the flag
Select the country from the list so its flag shows next to the person in Location View.
| What you can track | Where it goes |
|---|---|
| Current location | Where the person lives now |
| Birth location | Where they were born |
| Migration history | Documented in notes |
| Country | Drives the flag indicator |
Migration pattern analysis
| Pattern | What it looks like |
|---|---|
| Chain migration | Family members following pioneers |
| Return migration | Returning to ancestral homeland |
| Urban-rural shifts | Across generations |
| International dispersal | Family spread across countries |
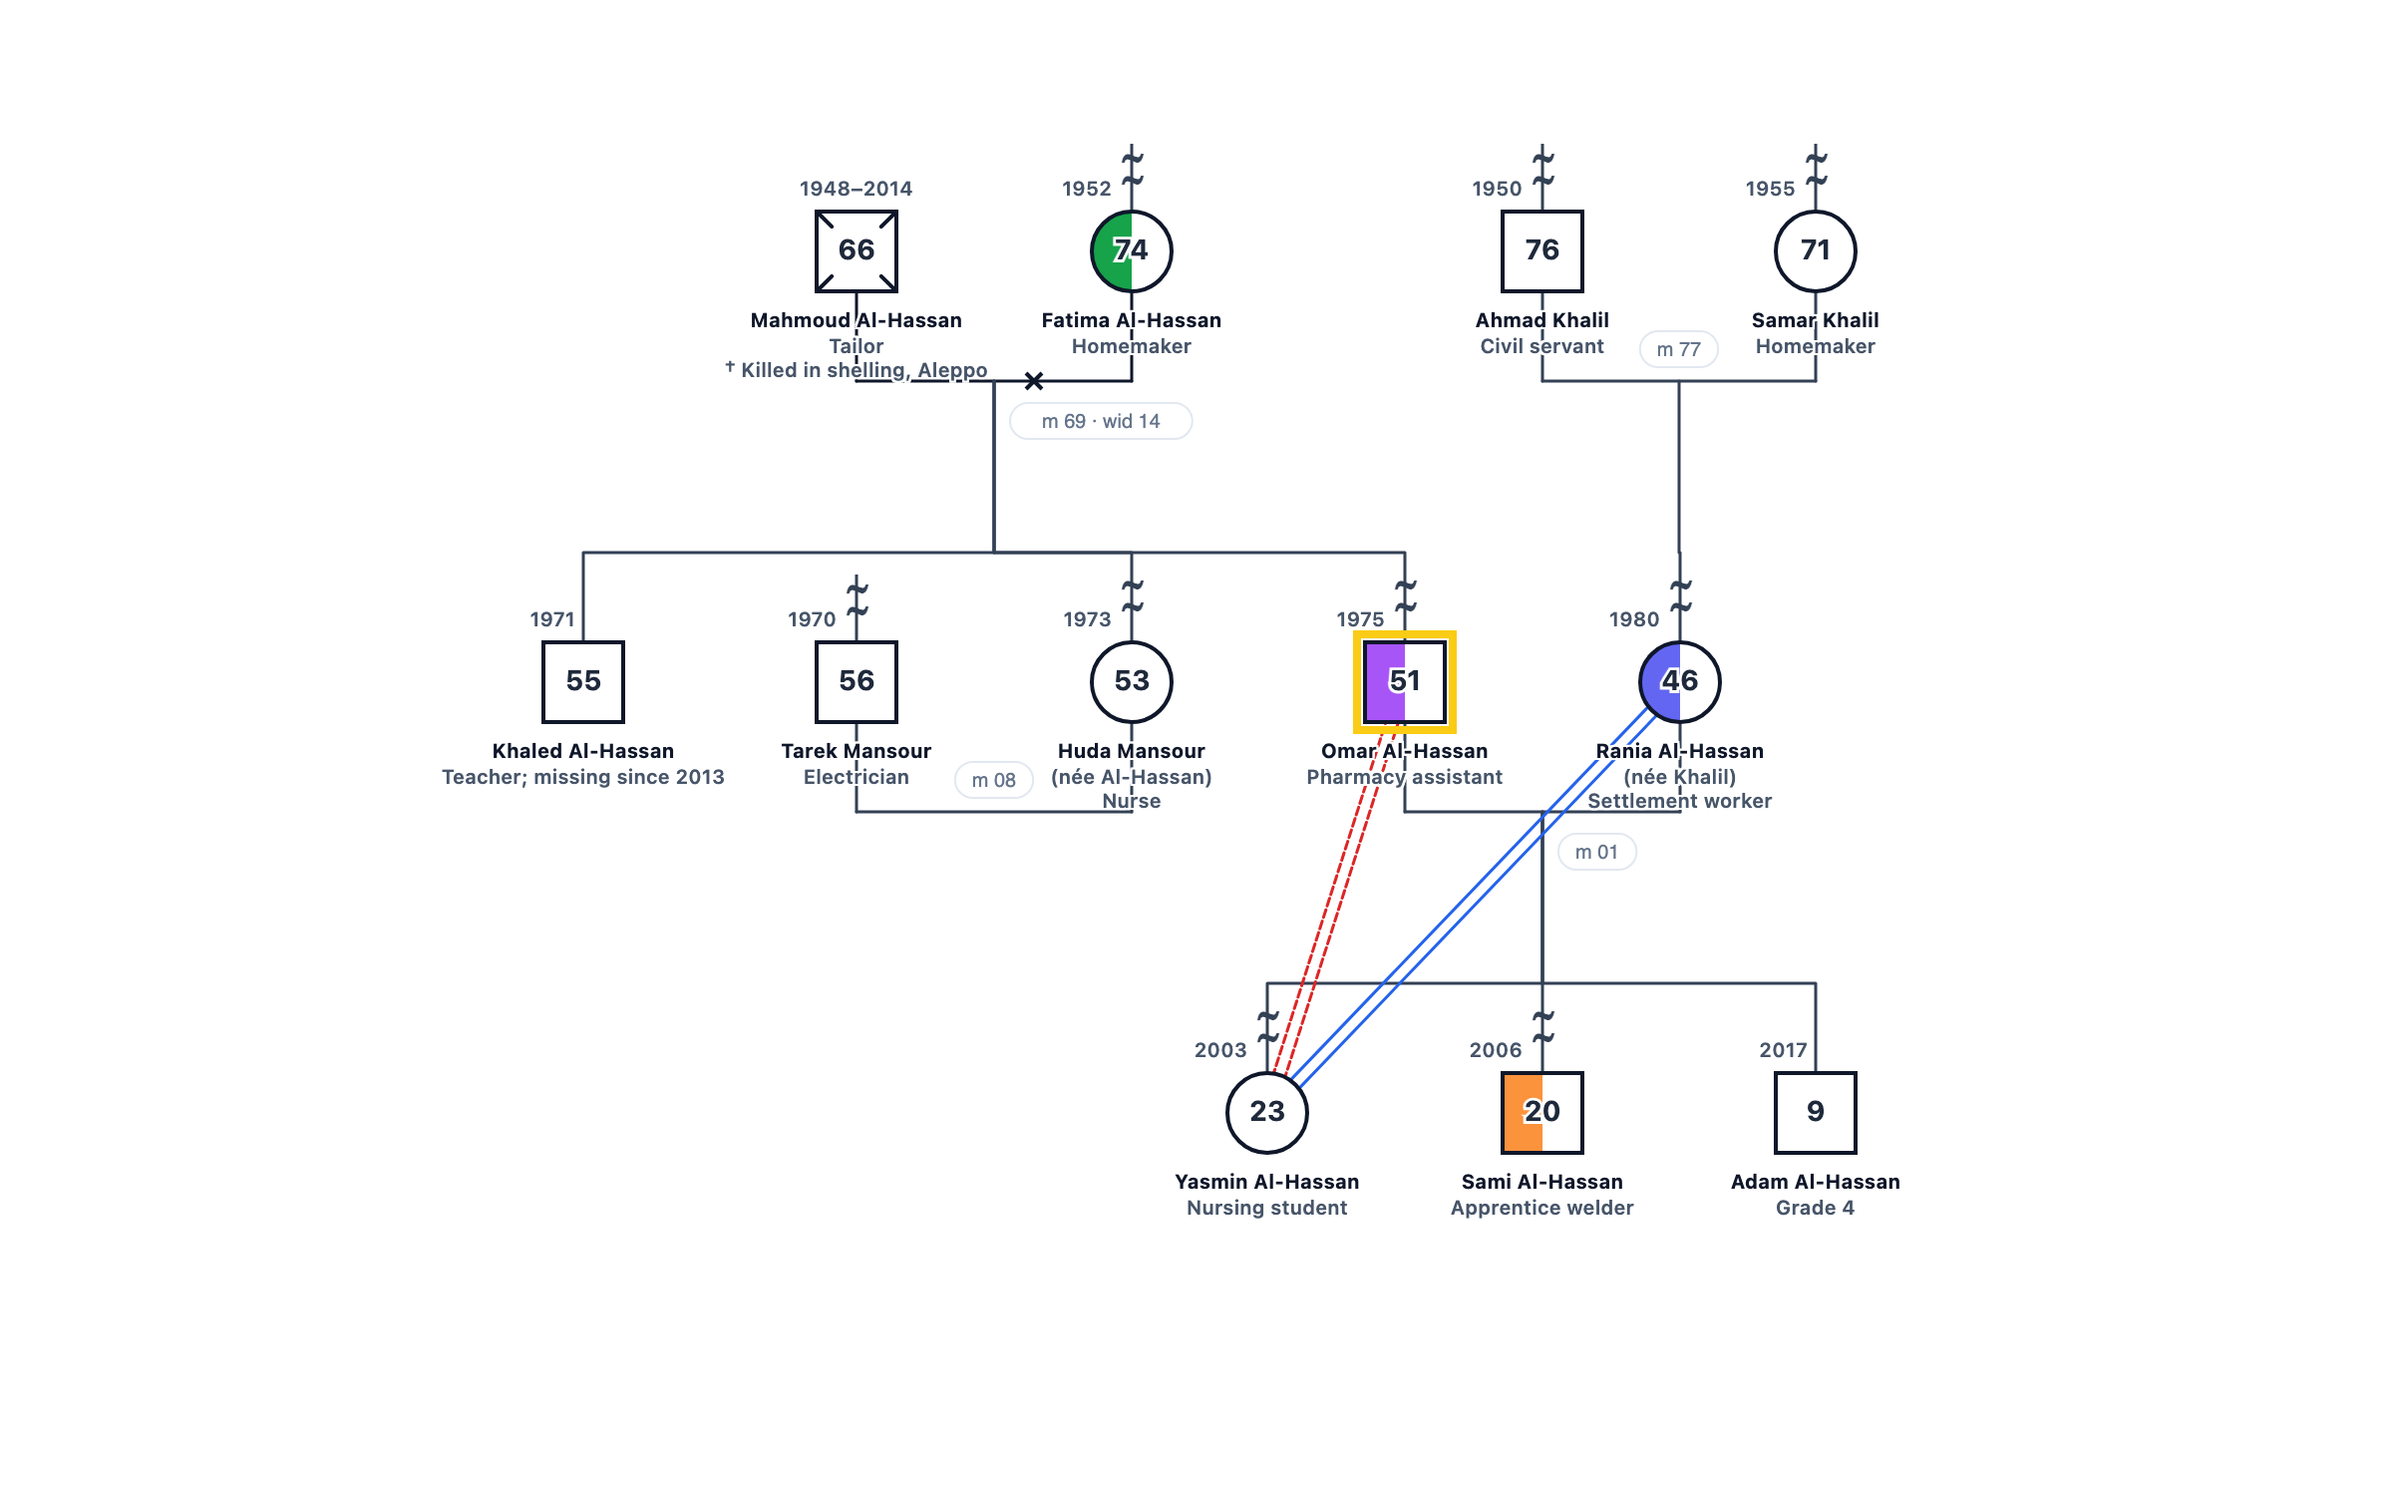
| Clustering | Multiple generations in same area |
Clinical applications
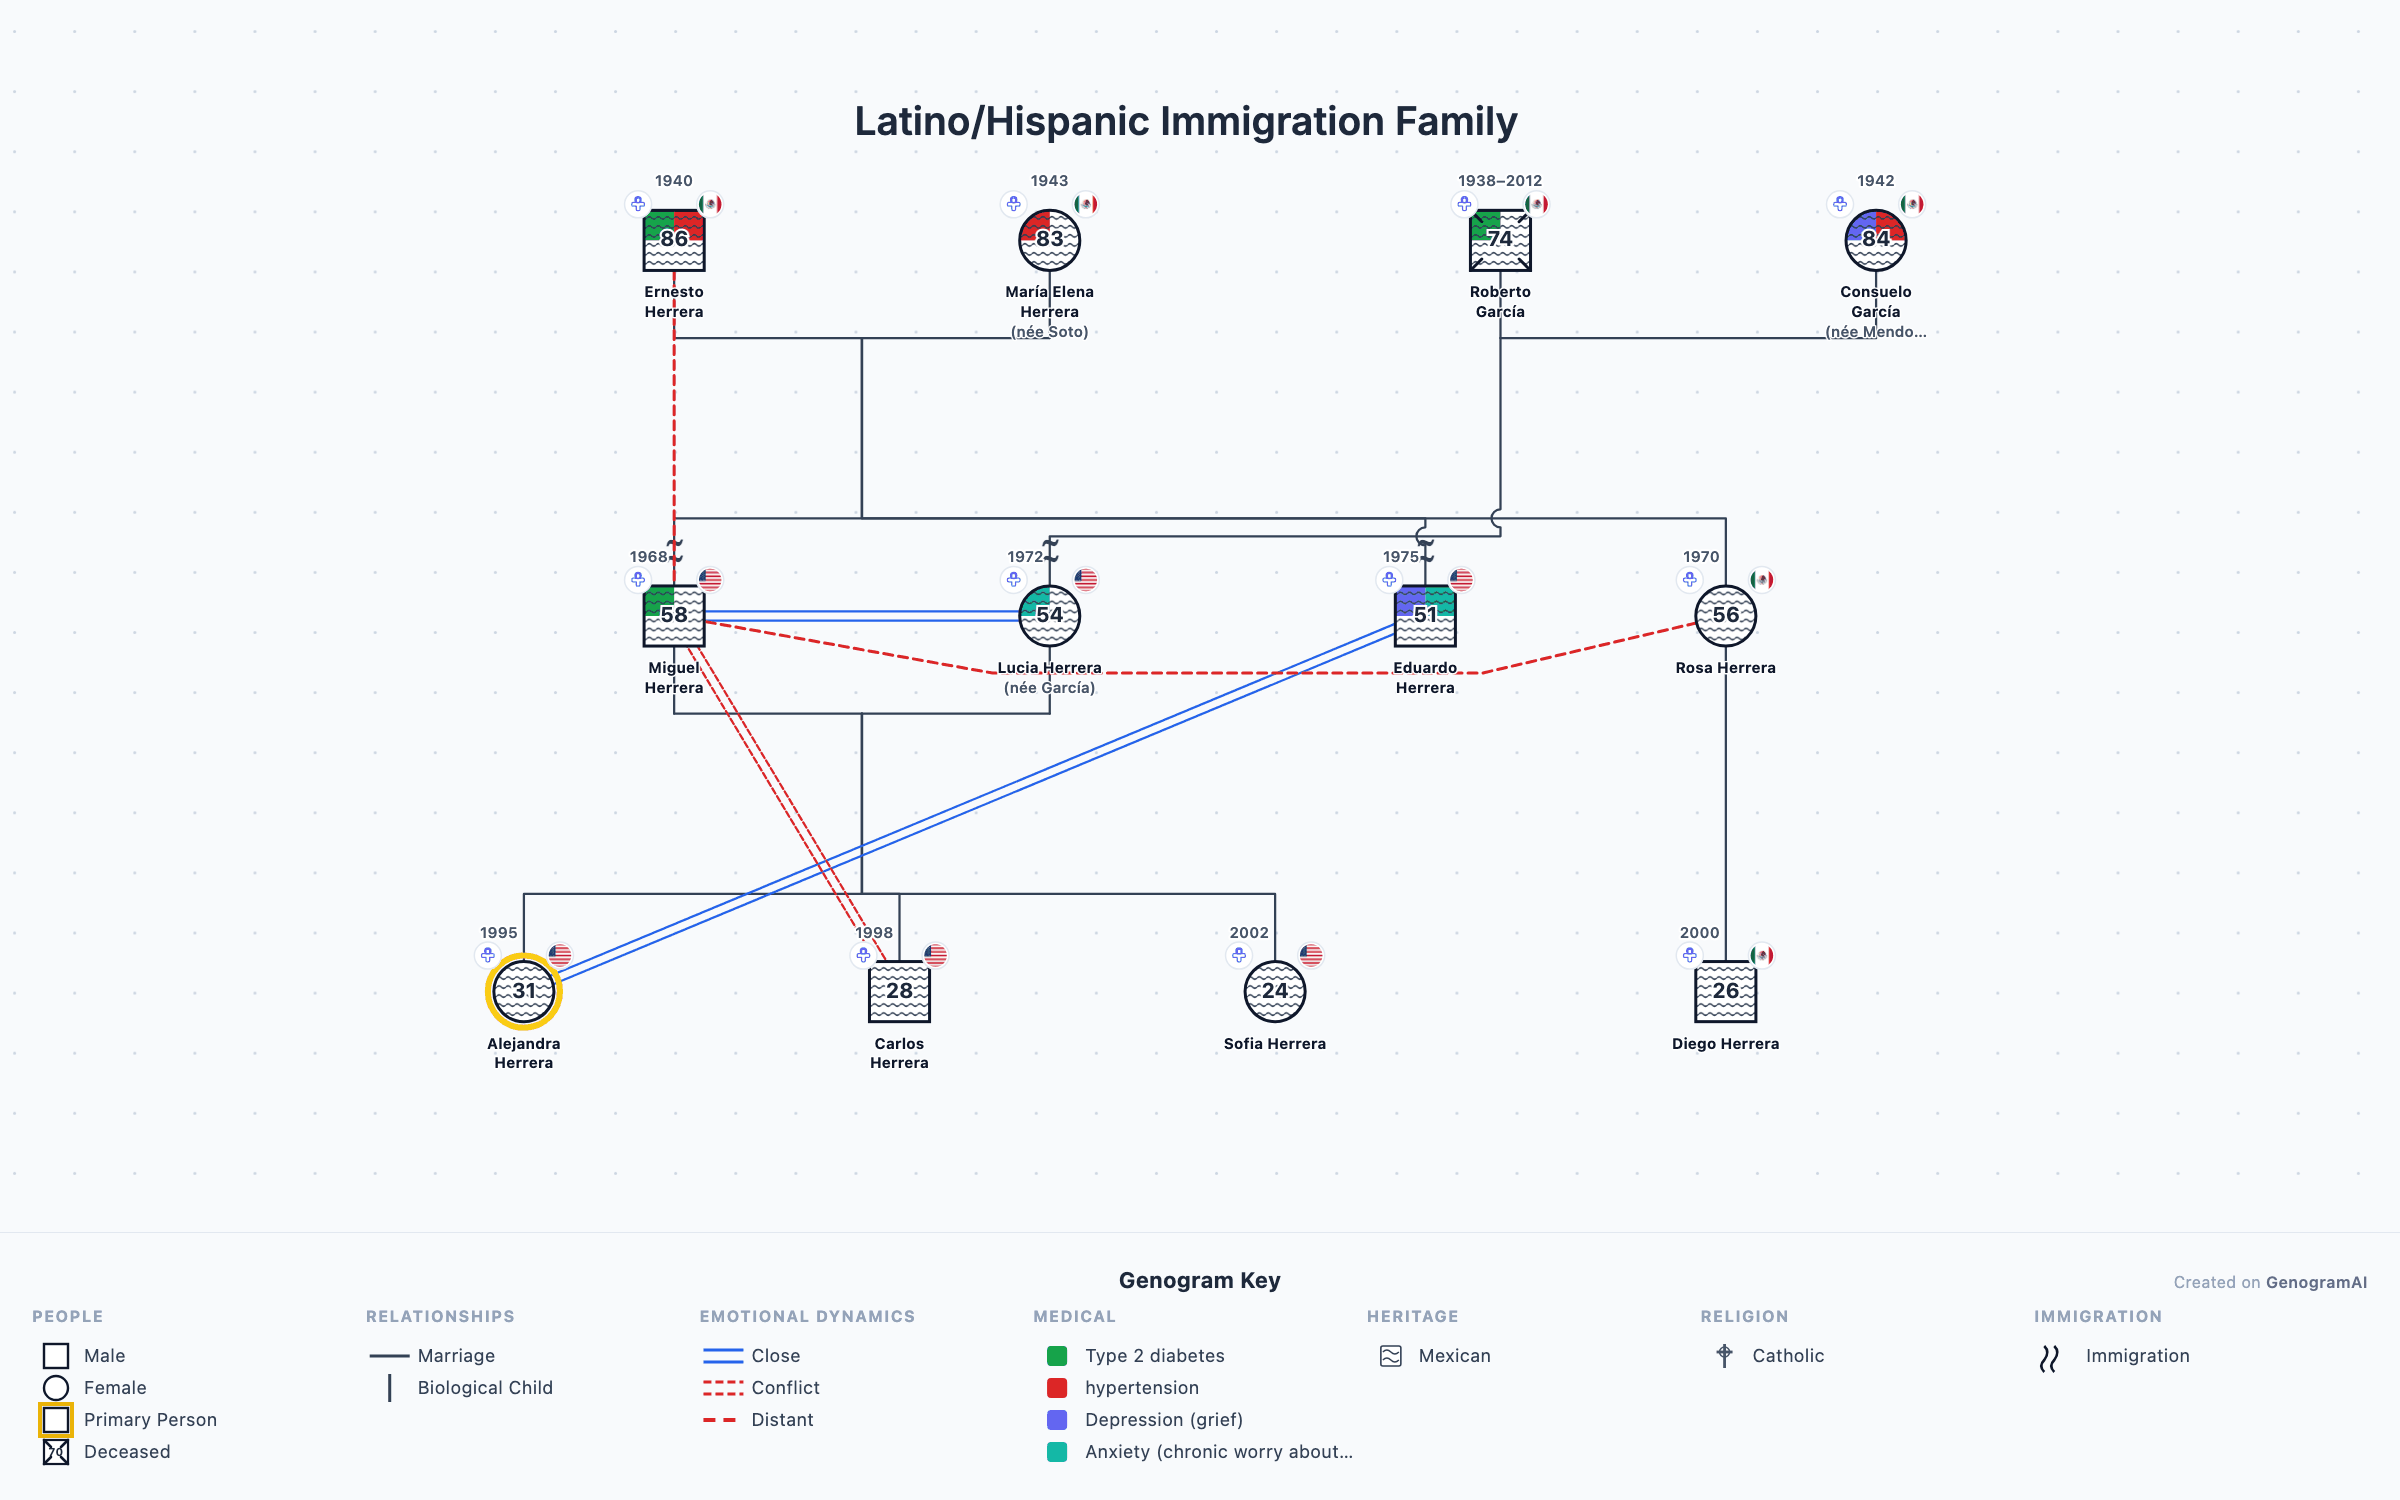
Immigration narratives: mapping the journey helps explore
- Who initiated the move and why
- Who was left behind and the impact
- Adaptation challenges across generations
- Maintenance or loss of cultural ties
- Legal status and its effects on family
Geographic distance and family dynamics: genograms can reveal
- Cut-offs facilitated by geographic distance
- The "identified family member" who stayed to care for elders
- Technology’s role in maintaining long-distance bonds
- Reunion patterns (holidays, funerals, crises)
Case example: the Martinez family
Mapping three generations revealed a clear pattern: the grandparents immigrated from Mexico to Texas, their children scattered across the Southwest, and grandchildren were now in California, Colorado, and back to Texas. The one grandchild who returned to Texas, near the grandparents, was serving as the family caretaker, carrying significant stress despite being the youngest sibling.
This geographic visualization helped the family understand why caregiving responsibilities fell unevenly and opened conversations about redistribution.
Supported countries
GenogramAI’s country picker includes flag indicators for more than 200 countries and territories, including:
- United States
- Mexico
- Canada
- United Kingdom
- Germany
- France
- Italy
- Spain
- China
- Japan
- India
- Brazil
- Australia
- South Korea
- Philippines
- Vietnam
Best practices
Tips for location tracking
- Ask about both current location and place of origin
- Note approximate dates of major moves
- Explore the circumstances of migration decisions
- Consider who stayed and who left, and why
- Use notes to capture migration stories
- Connect geographic changes to life events
Conclusion
Location data transforms genograms from static family trees into dynamic maps of family journeys. By tracking where family members live and where they came from, practitioners gain insight into cultural adaptation, family dispersal, caregiving patterns, and the geographic dimensions of family life. GenogramAI’s Location View makes this rich data visually accessible and clinically actionable.
Frequently asked questions
How do you show migration on a genogram?
Record each person’s birthplace and current location, add a country so its flag shows in Location View, and note the approximate dates and circumstances of major moves. Read across generations for chain migration, return migration, dispersal and clustering, and for who stayed near the elders and who left.
How many countries does GenogramAI have flags for?
The country picker in the Inspector’s Location section lists more than 200 countries and territories, each with its flag.
Where do migration stories go?
Use the person’s notes for the story behind a move: who initiated it and why, who was left behind, and legal status where relevant. The location fields hold the places; the notes hold the narrative.