Genogram example · Family structure
Social Work Genogram Example: Blended Family with Three Fathers
Quick answer
At a glance
| This example | |
|---|---|
| Generations | 2 |
| Family members | 10 |
| Index person | Jasmine Reid |
| Emotional relationships | Close |
| Conditions marked | Medical shading |
| Category | Family structure |
| Tags | Family Structure, Educational, Clinical |
About this genogram
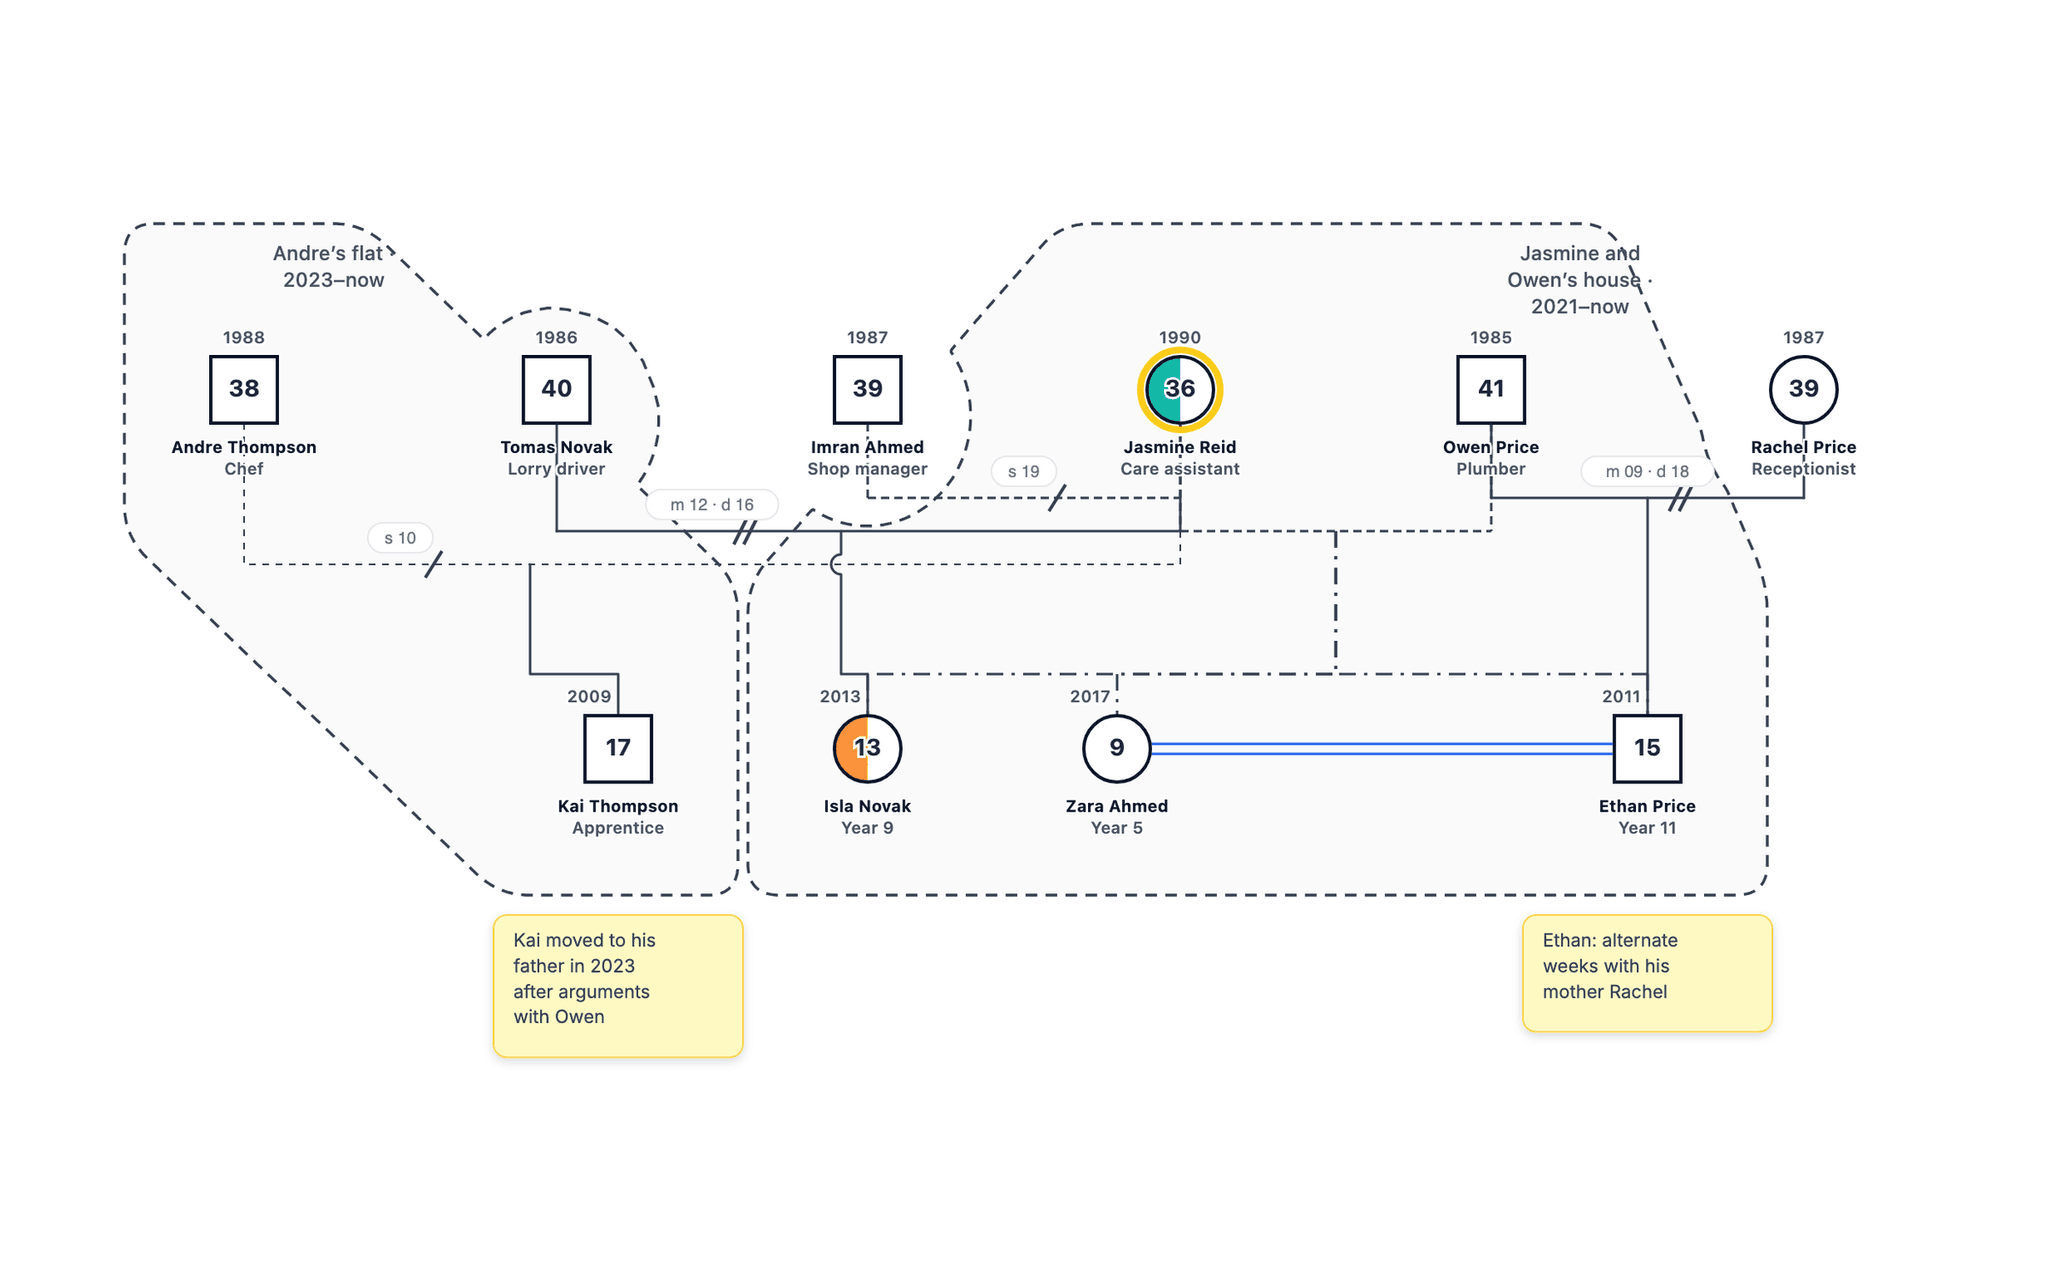
A social work genogram example of a blended family: a mother with three children by three different fathers, each child drawn under the right parents, her cohabiting partner and his son from his marriage, step lines, and two households. Built to show how to keep a complex family readable. The family is fictional.
Family analysis
Overview
This two-generation genogram maps 10 family members in two households. The index person is Jasmine Reid (36), a care assistant with anxiety, who has three children by three fathers and now lives with her partner Owen Price and his son. The example is written for social work students learning to keep a complex family readable.
Three fathers
Each of Jasmine’s relationships has its own couple line in time order. She dated Andre Thompson until 2010 (their son Kai is 17), was married to Tomas Novak from 2012 to 2016 (daughter Isla, 13, who has ADHD) and lived with Imran Ahmed until 2019 (daughter Zara, 9). Each child hangs from the line of their own parents, so the half-sibling relationships are visible without labels.
The current household
Since 2021 Jasmine has lived with Owen Price, drawn with a dashed cohabitation line. Owen was married to Rachel Price from 2009 to 2018, and their son Ethan (15) spends alternate weeks with each parent. Step lines connect Owen to Isla and Zara and Jasmine to Ethan. Zara and Ethan are close.
Two households
Kai moved out to live with his father in 2023 after arguments with Owen, so the chart has two household boundaries: Jasmine and Owen’s house, and Andre’s flat. A practitioner reading the chart can see at once that Kai is the only one of Jasmine’s children who does not live with her.
Teaching use
As a teaching example it shows the three rules that keep blended families clear: one couple line per relationship, children under their own parents, and households drawn as boundaries rather than by moving people around. Names and details are fictional.
How do you read the Social Work Genogram Example: Blended Family with Three Fathers?
- 1
Find each person and generation
Squares are males and circles are females, and each row is one generation, oldest at the top. It spans 2 generations. - 2
Follow the family lines
Horizontal lines join partners and vertical lines drop to their children, born left to right in birth order. This genogram uses Divorce, Cohabitation, Ended unmarried relationship, Ended dating relationship, Parent-child line and Step-parent line lines. - 3
Read the emotional lines
Lines drawn between two people show how they relate: Close. Notice who has several lines converging on them, and which patterns repeat from one generation to the next. - 4
Read the shading
Shaded symbols mark health conditions: Medical shading. Trace each line of descent to see where a condition recurs and where it stops.
Genogram symbols used in this example
| Symbol | Type | What it means |
|---|---|---|
| Male (Square) | Person Symbols | A square represents a male family member. |
| Female (Circle) | Person Symbols | A circle represents a female family member. |
| Index person (highlighted outline) | Person Symbols | The person at the centre of the assessment is drawn with a highlighted outline. |
| Age inside the symbol | Person Symbols | The current age (or age at death) is written inside each symbol, with years above it. |
| Divorce | Couples | Two slashes across the couple line mark a divorce, with the year (d 02). |
| Cohabitation | Couples | A dashed couple line marks partners who live together without marrying. |
| Ended unmarried relationship | Couples | A dashed or dotted couple line with one slash marks an unmarried relationship that has ended. |
| Ended dating relationship | Couples | A dotted couple line with one slash marks a dating relationship that has ended. |
| Parent-child line | Children | A vertical line from the couple line to each child; siblings run oldest to youngest from left to right. |
| Step-parent line | Children | A dash-dot line connects a step-parent to a partner’s child. |
| Household boundary | Households and Notes | A dashed outline around the people who live together, labelled with the household name and the year it began. |
| Text note | Households and Notes | A yellow note on the chart records information that has no symbol, such as previous involvement, contact arrangements or a relative’s offer of support. |
| Close | Emotional Relationships | Two parallel blue lines mark an emotionally close relationship. |
| Medical shading | Medical | The left half of a symbol is shaded for a physical or mental illness and the bottom half for alcohol or drug use; each condition has its own colour, listed in the key. Hatching means suspected, a partial fill means in recovery. |
Build a genogram like this one
Example prompt
- 1
Start from the dashboard
Sign in to GenogramAI and choose Create with AI (paid plans), or open a blank genogram and use Ask AI (any plan). To start from this exact chart instead, use Open as template. - 2
Describe your family
Paste a description like the one above, with your own names, dates, relationships and health history. - 3
Check and adjust
Edit people and lines by hand, or ask the AI for one change at a time. - 4
Export
Download a PNG on the free plan. PDF and SVG export are on paid plans.
The free plan includes 2 genograms and 5 AI credits a month. See the AI genogram creator for what else it can do.
Related resources
- See how half-siblings are drawn in standard notation.
- More examples and tips in genograms for social work students.
- For a similar family in a child protection case, see the child protection genogram.
- More on household boundaries.
Frequently asked questions
How do you draw a mother with children by different fathers?
Draw a separate couple line from the mother to each father, in time order, and hang each child from the line of their own parents. Kai is under Jasmine and Andre, Isla under Jasmine and Tomas, Zara under Jasmine and Imran. Each line also shows how the relationship ended: a slash for a dating relationship or cohabitation that ended, two slashes for the divorce.
How do you show a partner’s child from a previous relationship?
Draw the child under his own parents (Ethan under Owen and Rachel) and add a dash-dot step line from the new partner, Jasmine. Owen has step lines to Isla and Zara in the same way.
How do you show two households?
Draw a dashed boundary around each household and name it. Jasmine, Owen, Isla, Zara and Ethan live in one; Kai lives with his father Andre in the other. A note records that Ethan spends alternate weeks with his mother.
Why does the order of partners matter?
Partners are placed in time order so the chart can be read left to right as a history. Jasmine’s earlier partners sit to her left, her current partner Owen to her right, and his former wife Rachel beyond him.
Can I build a genogram like the Social Work Genogram Example: Blended Family with Three Fathers example?
Yes. Open GenogramAI, choose Create with AI on the dashboard (paid plans) or open a blank genogram and use Ask AI in the editor (any plan), and describe the family in plain words: who is in it, how they are related, key dates and the relationships or health conditions you want to show. The AI draws the symbols and lines, and you can then edit by hand or ask for one change at a time. A family of 10 people like this one takes a short paragraph to describe. The free plan includes 2 genograms and 5 AI credits a month, with PNG export.
About this example