Genogram example · Specialty
Child Protection Genogram: UK Children’s Social Care
Quick answer
At a glance
| This example | |
|---|---|
| Generations | 3 |
| Family members | 12 |
| Emotional relationships | Violence, Neglect (physical), Close and Conflict |
| Conditions marked | Medical shading |
| Category | Specialty |
| Tags | Clinical, Substance Use, Family Structure |
About this genogram
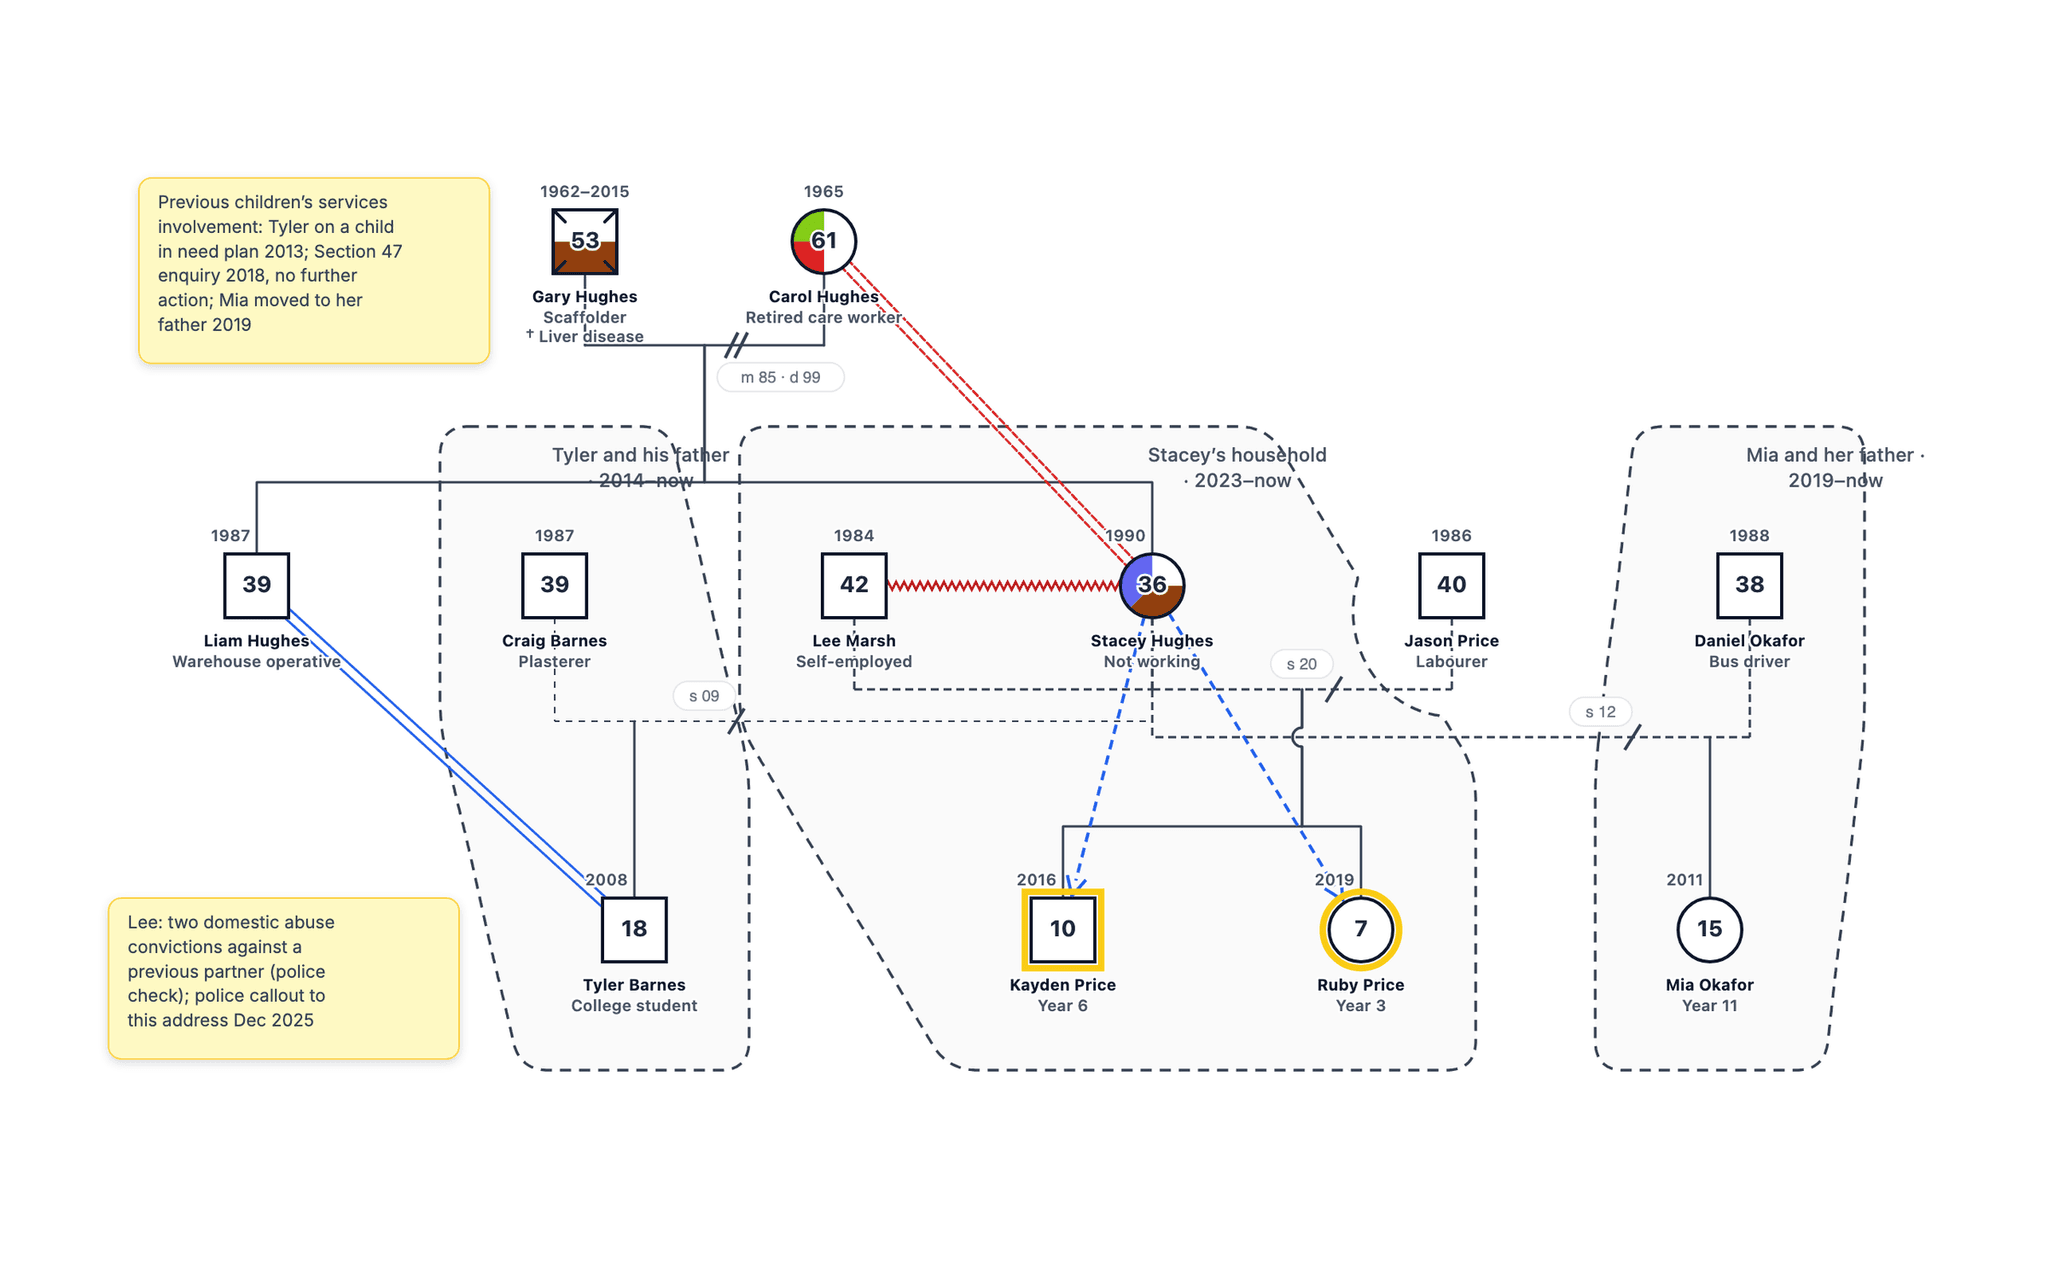
A genogram of the kind a local authority social worker draws for two children on child protection plans under the category of neglect. It shows the mother’s alcohol misuse, her partner’s domestic abuse history as a violence line, half-siblings who live with their own fathers in other households, a maternal grandmother in poor health, household boundaries and earlier children’s services involvement as a note. The family is fictional.
Family analysis
Overview
This three-generation genogram maps 12 family members across three households for a fictional child protection case. The children at the centre of the assessment are Kayden Price (10) and Ruby Price (7), who have been subject to child protection plans under the category of neglect since an initial child protection conference in February 2026. They live with their mother, Stacey Hughes (36), and her partner, Lee Marsh, who moved in during 2023.
The concerns
The concerns centre on Stacey’s alcohol misuse, shaded on her symbol together with depression, and on Lee’s history of domestic abuse. Police checks show two convictions for abuse of a previous partner, and officers were called to the address in December 2025. The violence line between Lee and Stacey and the neglect arrows from Stacey to both children put those concerns where the conference can see them.
Three households
Stacey has four children by three fathers. Tyler (18) has lived with his father, Craig Barnes, since 2014, and Mia (15) with her father, Daniel Okafor, since 2019; each is drawn inside a separate household boundary. Kayden and Ruby’s father, Jason Price, separated from Stacey in 2020. Separate households matter for sibling contact and for deciding who to approach as a possible carer.
Risk and support in the wider family
The wider family holds both risk and support. Stacey’s father, Gary, died of liver disease in 2015 after years of alcohol dependence, so the drinking pattern spans two generations. Her mother, Carol, is close to the children but lives with COPD and heart failure, and her relationship with Stacey is in conflict. Stacey’s brother Liam is close to Tyler and has not yet been asked what he could offer. The note on previous involvement shows the family has been known to children’s services since 2013.
Using it in the case
In practice the genogram supports the core group and the review conference. It points to Jason’s family and to Liam as relatives to explore at a family network meeting, keeps the half-siblings in view and records the source of each concern. Names and details are fictional.
How do you read the Child Protection Genogram: UK Children’s Social Care?
- 1
Find each person and generation
Squares are males and circles are females, and each row is one generation, oldest at the top. It spans 3 generations. - 2
Follow the family lines
Horizontal lines join partners and vertical lines drop to their children, born left to right in birth order. This genogram uses Divorce, Cohabitation, Ended unmarried relationship and Ended dating relationship lines. - 3
Read the emotional lines
Lines drawn between two people show how they relate: Violence, Neglect (physical), Close and Conflict. Notice who has several lines converging on them, and which patterns repeat from one generation to the next. - 4
Read the shading
Shaded symbols mark health conditions: Medical shading. Trace each line of descent to see where a condition recurs and where it stops.
Genogram symbols used in this example
| Symbol | Type | What it means |
|---|---|---|
| Male (Square) | Person Symbols | A square represents a male family member. |
| Female (Circle) | Person Symbols | A circle represents a female family member. |
| Index person (highlighted outline) | Person Symbols | The person at the centre of the assessment is drawn with a highlighted outline. |
| Deceased (X) | Person Symbols | An X through the symbol marks a person who has died; birth and death years are written above it. |
| Age inside the symbol | Person Symbols | The current age (or age at death) is written inside each symbol, with years above it. |
| Divorce | Couples | Two slashes across the couple line mark a divorce, with the year (d 02). |
| Cohabitation | Couples | A dashed couple line marks partners who live together without marrying. |
| Ended unmarried relationship | Couples | A dashed or dotted couple line with one slash marks an unmarried relationship that has ended. |
| Ended dating relationship | Couples | A dotted couple line with one slash marks a dating relationship that has ended. |
| Household boundary | Households and Notes | A dashed outline around the people who live together, labelled with the household name and the year it began. |
| Text note | Households and Notes | A yellow note on the chart records information that has no symbol, such as previous involvement, contact arrangements or a relative’s offer of support. |
| Parent-child line | Households and Notes | A vertical line from the couple line to each child; siblings run oldest to youngest from left to right. |
| Violence | Emotional Relationships | A tight dark red zigzag between two people marks physical violence or the threat of it. |
| Neglect (physical) | Emotional Relationships | A dashed blue arrow points from the carer to the child when physical care, food or supervision is not provided. |
| Close | Emotional Relationships | Two parallel blue lines mark an emotionally close relationship. |
| Conflict | Emotional Relationships | Dashed red double lines mark open conflict. |
| Medical shading | Medical | The left half of a symbol is shaded for a physical or mental illness and the bottom half for alcohol or drug use; each condition has its own colour, listed in the key. Hatching means suspected, a partial fill means in recovery. |
Build a genogram like this one
Example prompt
- 1
Start from the dashboard
Sign in to GenogramAI and choose Create with AI (paid plans), or open a blank genogram and use Ask AI (any plan). To start from this exact chart instead, use Open as template. - 2
Describe your family
Paste a description like the one above, with your own names, dates, relationships and health history. - 3
Check and adjust
Edit people and lines by hand, or ask the AI for one change at a time. - 4
Export
Download a PNG on the free plan. PDF and SVG export are on paid plans.
The free plan includes 2 genograms and 5 AI credits a month. See the AI genogram creator for what else it can do.
Related resources
- Read the full guide to genograms in UK children’s social care.
- A natural next step for a family like this is a family network meeting genogram with both sides of the family.
- See the violence line in the symbols guide.
- For US practice, see genograms in child welfare.
Frequently asked questions
When is a genogram drawn in a Section 47 enquiry?
A Section 47 enquiry under the Children Act 1989 looks at whether a child is suffering, or is likely to suffer, significant harm. The genogram is usually started from the referral, police checks and the first home visits, so the strategy discussion and the initial child protection conference can see who lives with the children, which adults have contact with them and who in the wider family might help. In this example it was drawn in January 2026 and updated for the conference in February.
How do you show domestic abuse on a genogram?
A violence line, drawn as a tight dark red zigzag, joins the two adults. Here it runs between Lee Marsh and Stacey Hughes. Where the information came from goes in a note (here, police checks and a callout in December 2025), so a reader can tell a reported concern from a finding.
How are half-siblings in other households shown?
Each child sits under the couple line of their own parents: Tyler under Stacey and Craig, Mia under Stacey and Daniel, Kayden and Ruby under Stacey and Jason. Tyler and Mia each have a household boundary with their father, separate from Stacey’s household.
Where does previous children’s services involvement go?
In a short text note beside the family, with years: earlier plans, enquiries, proceedings and moves between households. This note records a child in need plan for Tyler in 2013, a Section 47 enquiry in 2018 that ended with no further action, and Mia’s move to her father in 2019.
Can I build a genogram like the Child Protection Genogram: UK Children’s Social Care example?
Yes. Open GenogramAI, choose Create with AI on the dashboard (paid plans) or open a blank genogram and use Ask AI in the editor (any plan), and describe the family in plain words: who is in it, how they are related, key dates and the relationships or health conditions you want to show. The AI draws the symbols and lines, and you can then edit by hand or ask for one change at a time. A family of 12 people like this one takes a short paragraph to describe. The free plan includes 2 genograms and 5 AI credits a month, with PNG export.
About this example