Genogram example · Specialty
Family Network Meeting Genogram: Offers of Support
Quick answer
At a glance
| This example | |
|---|---|
| Generations | 3 |
| Family members | 11 |
| Emotional relationships | Close and Distant |
| Conditions marked | Medical shading |
| Category | Specialty |
| Tags | Family Structure, Clinical, Cultural |
About this genogram
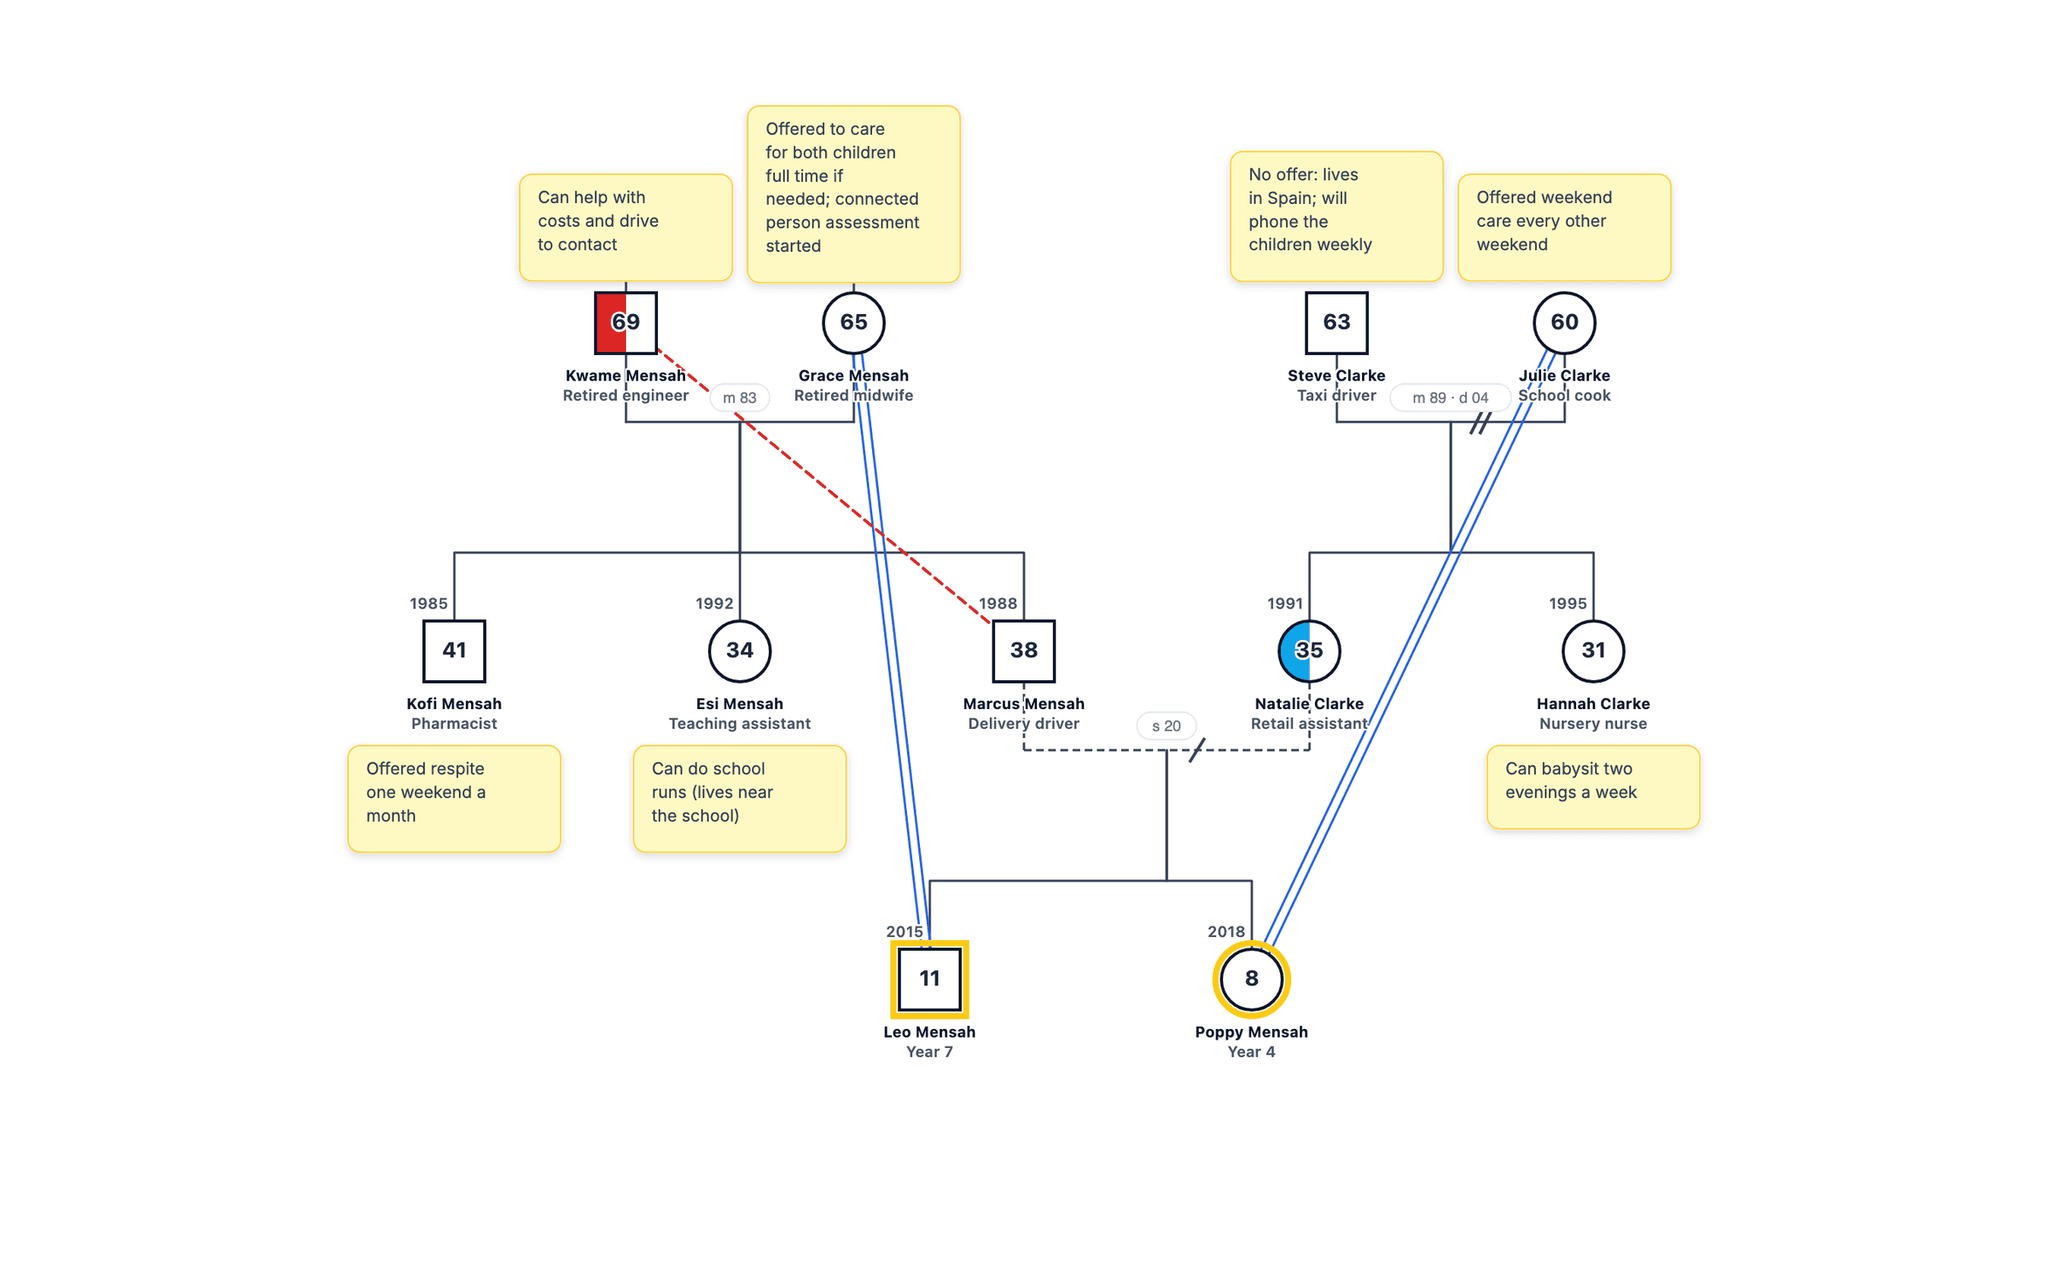
A genogram prepared for a family network meeting (family group conference) about two children whose mother has been admitted to hospital. Both sides of the family are drawn, including the paternal Ghanaian-British family, which had not been contacted before. A note beside each relative records what they offered, from full-time care to school runs, and close and distant lines show where support is real. The family is fictional.
Family analysis
Overview
This three-generation genogram maps 11 family members on both sides of a fictional family. The children at the centre of the assessment are Leo Mensah (11) and Poppy Mensah (8). They live with their mother, Natalie Clarke (35), who has bipolar disorder and was admitted to hospital in September 2026. Their parents separated in 2020, and the children stayed with their maternal grandmother, Julie, for two weeks during the admission.
The offers
Each relative carries a note recording what they offered at the meeting in October 2026. On the maternal side, Julie offered weekend care every other weekend and Natalie’s sister Hannah can babysit two evenings a week; her father Steve, who lives in Spain, made no offer of care but will phone the children weekly. On the paternal side, Grace offered full-time care if it is needed, Kwame can help with costs and drive to contact, Kofi offered respite one weekend a month and Esi can do school runs because she lives near the school.
The paternal family
Before the meeting the genogram showed only Natalie’s family. The father, Marcus, named his parents and siblings when the social worker went through the chart with him, and they attended for the first time. Kwame and Grace both migrated from Ghana, marked with immigration lines, and their family is the larger source of practical help.
Relationships behind the offers
Close lines run from Grace to Leo and from Julie to Poppy, so both grandmothers already have a relationship with one of the children. Marcus is distant from his father, and that distance is worth knowing when the plan relies on Kwame for transport to contact.
Using it at the meeting
At the meeting the genogram works as the agenda. The family can see every relative at once, the notes become the family plan, and the chart goes into the record with the date and the source of each offer. Names and details are fictional.
How do you read the Family Network Meeting Genogram: Offers of Support?
- 1
Find each person and generation
Squares are males and circles are females, and each row is one generation, oldest at the top. It spans 3 generations. - 2
Follow the family lines
Horizontal lines join partners and vertical lines drop to their children, born left to right in birth order. This genogram uses Marriage, Divorce, Ended unmarried relationship and Immigration marker lines. - 3
Read the emotional lines
Lines drawn between two people show how they relate: Close and Distant. Notice who has several lines converging on them, and which patterns repeat from one generation to the next. - 4
Read the shading
Shaded symbols mark health conditions: Medical shading. Trace each line of descent to see where a condition recurs and where it stops.
Genogram symbols used in this example
| Symbol | Type | What it means |
|---|---|---|
| Male (Square) | Person Symbols | A square represents a male family member. |
| Female (Circle) | Person Symbols | A circle represents a female family member. |
| Index person (highlighted outline) | Person Symbols | The person at the centre of the assessment is drawn with a highlighted outline. |
| Age inside the symbol | Person Symbols | The current age (or age at death) is written inside each symbol, with years above it. |
| Marriage | Couples | A solid line between partners; the marriage year is written on the line (m 90 = married 1990). |
| Divorce | Couples | Two slashes across the couple line mark a divorce, with the year (d 02). |
| Ended unmarried relationship | Couples | A dashed or dotted couple line with one slash marks an unmarried relationship that has ended. |
| Immigration marker | Couples | A double wavy mark on a person’s line records immigration; a single wavy mark records living across two cultures. |
| Text note | Notes | A yellow note on the chart records information that has no symbol, such as previous involvement, contact arrangements or a relative’s offer of support. |
| Parent-child line | Notes | A vertical line from the couple line to each child; siblings run oldest to youngest from left to right. |
| Close | Emotional Relationships | Two parallel blue lines mark an emotionally close relationship. |
| Distant | Emotional Relationships | A red dashed line marks emotional distance between two people. |
| Medical shading | Medical | The left half of a symbol is shaded for a physical or mental illness and the bottom half for alcohol or drug use; each condition has its own colour, listed in the key. Hatching means suspected, a partial fill means in recovery. |
Build a genogram like this one
Example prompt
- 1
Start from the dashboard
Sign in to GenogramAI and choose Create with AI (paid plans), or open a blank genogram and use Ask AI (any plan). To start from this exact chart instead, use Open as template. - 2
Describe your family
Paste a description like the one above, with your own names, dates, relationships and health history. - 3
Check and adjust
Edit people and lines by hand, or ask the AI for one change at a time. - 4
Export
Download a PNG on the free plan. PDF and SVG export are on paid plans.
The free plan includes 2 genograms and 5 AI credits a month. See the AI genogram creator for what else it can do.
Related resources
- The family network meeting is one stage covered in our guide to genograms in children’s social care.
- When a relative’s offer leads to a placement, see the special guardianship genogram.
- See the close relationship line and the distant line in the symbols guide.
- More on genograms for social workers.
Frequently asked questions
What is a family network meeting genogram?
It is the genogram brought to a family network meeting or family group conference, updated with what each relative can offer. It helps the family and the social worker see the whole network at once and build a family plan from real offers rather than from whoever happens to be in the room.
How do you record each relative’s offer of support?
Add a short text note beside the person, in their own terms and with the detail that matters: "Offered weekend care every other weekend", "Can do school runs (lives near the school)". A relative who cannot help gets a note too, so nobody is assumed to have been forgotten. Here Steve’s note says he lives in Spain and will phone the children weekly.
Why draw the paternal family if the father is not involved?
Fathers’ families are the relatives most often missed. In this example Marcus’s parents, brother and sister had never been contacted; at the meeting his mother Grace offered to care for both children full time, and a connected person assessment was started.
What do the close and distant lines add?
They show which offers rest on an existing relationship. Grace is close to Leo and Julie is close to Poppy, so their offers come from people the children already know. Marcus is distant from his father Kwame, which is useful to know before planning contact.
Can I build a genogram like the Family Network Meeting Genogram: Offers of Support example?
Yes. Open GenogramAI, choose Create with AI on the dashboard (paid plans) or open a blank genogram and use Ask AI in the editor (any plan), and describe the family in plain words: who is in it, how they are related, key dates and the relationships or health conditions you want to show. The AI draws the symbols and lines, and you can then edit by hand or ask for one change at a time. A family of 11 people like this one takes a short paragraph to describe. The free plan includes 2 genograms and 5 AI credits a month, with PNG export.
About this example