Free genogram template
Genogram and Eco-Map Template
Quick answer
Download the genogram and eco-map template
- Blank template (PDF)US Letter, print and fill in by hand
- Editable PowerPoint (.pptx)Every symbol and line is a shape; opens in Google Slides and Keynote
- Filled example + blank (PDF)Two pages: the example with its key, then the blank
- High-resolution example (PNG)2400 px wide, free to reuse with credit
- Vector blank (SVG)Edit in Illustrator, Inkscape, Figma or Canva
When to use a genogram and eco-map template
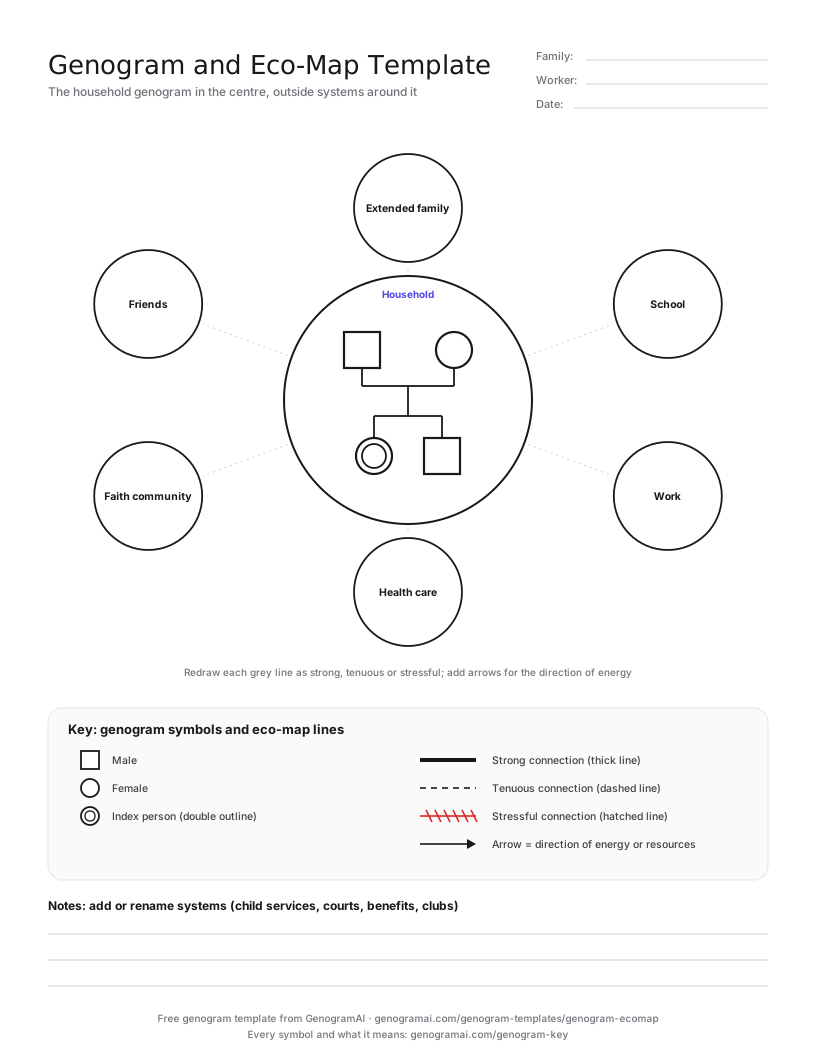
Use the combined template when an assessment needs both who is in the family and how the family connects to the world around it. The genogram in the centre shows the household’s structure; the eco-map around it, first described by Ann Hartman in 1978, shows the systems the family deals with: school, work, health care, faith community, friends, extended family. Social workers often draw both at intake because supports and stressors outside the home drive many of the decisions they make.
Each connection line records quality as well as existence: a thick solid line for a strong, supportive tie, a dashed line for a tenuous one, and a hatched line for a stressful one, with arrows showing whether energy and resources flow towards the family or away from it. Add or rename the outer circles to fit the family; child services, courts, benefits offices and treatment providers are common additions.
For a standalone eco-map, see the Eco-Map Template. For a deeper explanation of when to use each tool, see Eco-Map and Genogram. If the focus is one child’s placement, the Child Welfare Genogram Template is more specific.
The blank template and a filled-in example
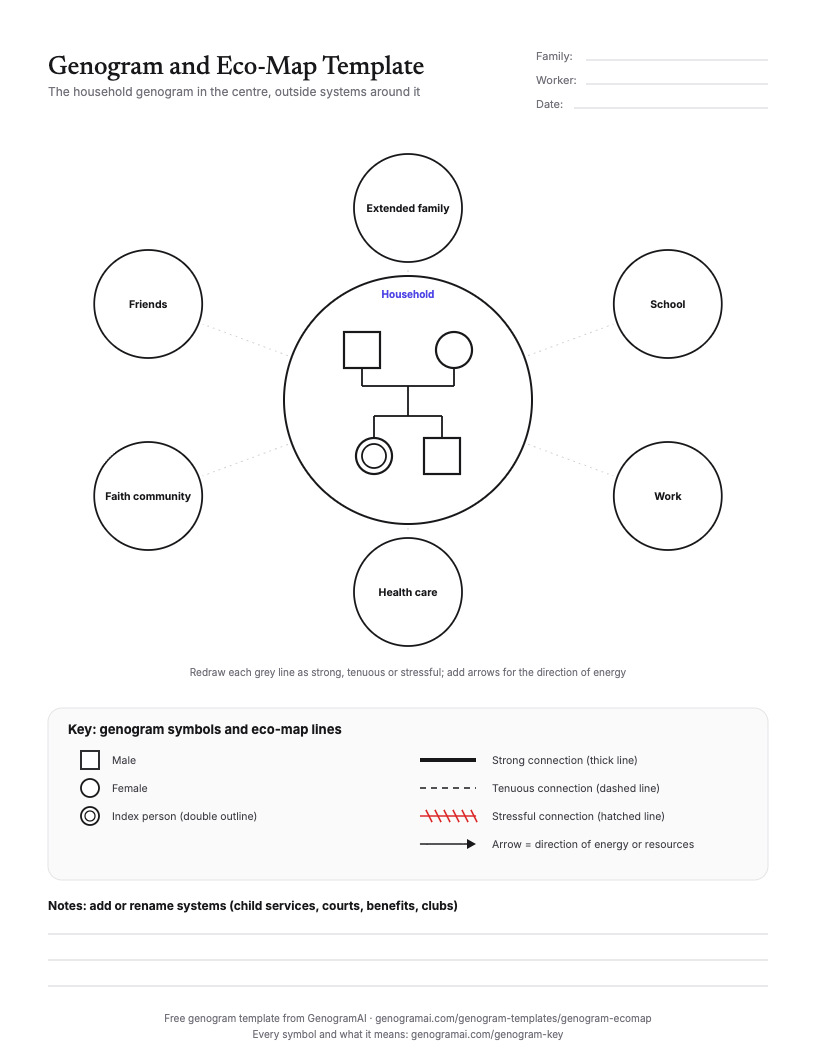
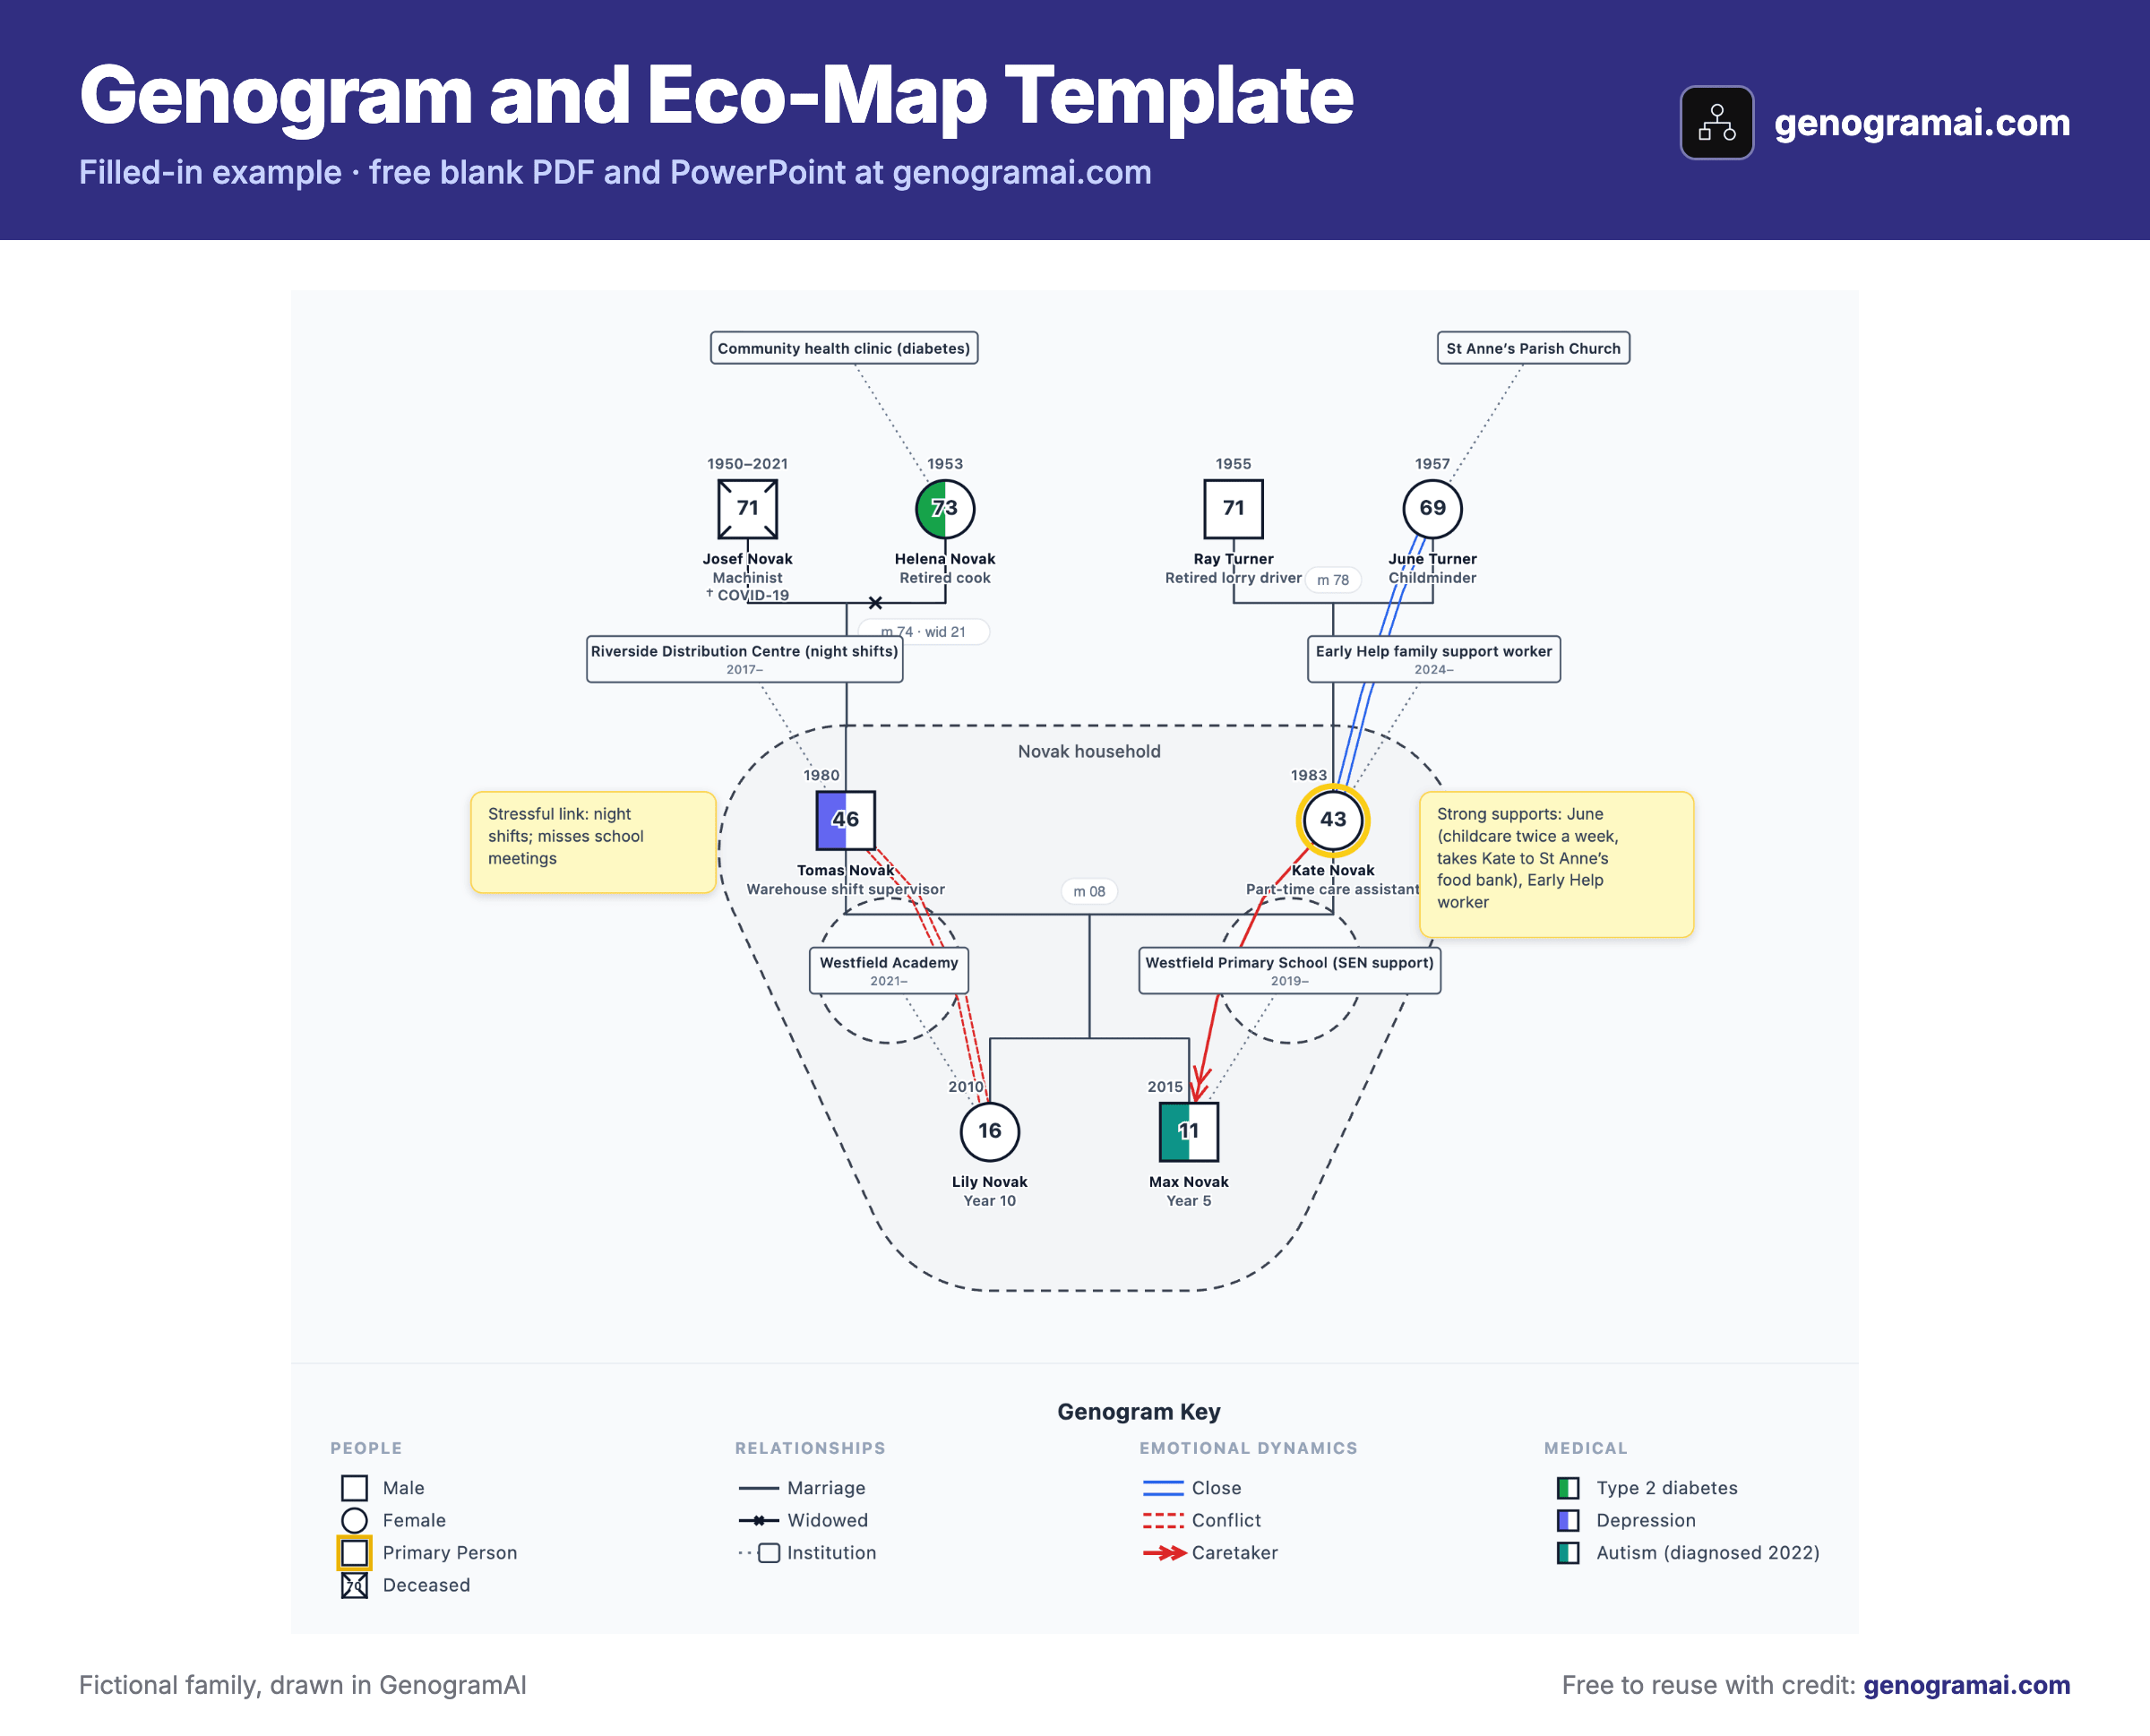
Open this example in GenogramAI to start from the finished layout: it copies into your account (the Free plan holds 2 genograms) and every person, line and condition stays editable.
How to fill in a genogram and eco-map template
- 1
Draw the household genogram
Place the people who live together inside the central circle with their partner and child lines. - 2
Name the outside systems
Label the outer circles with the systems that matter to this family; add or remove circles as needed. - 3
Draw each connection
Link each system to the household or to one person, choosing strong, tenuous or stressful lines. - 4
Add direction and notes
Add arrows for the flow of energy or resources and note what each connection involves.
Symbols this template uses
| Symbol | What it means |
|---|---|
| Central circle | The household, with its genogram drawn inside. |
| Outer circles | Outside systems: extended family, school, work, health care, faith community, friends, and any others relevant to the family. |
| Thick solid line | A strong, supportive connection. |
| Dashed line | A tenuous or weak connection. |
| Hatched line | A stressful or conflicted connection. |
| Arrow on a line | Direction of energy or resources: towards the family, away from it, or both. |
| Institution box | In GenogramAI, a service or institution linked to one person, with dates. |
Common mistakes to avoid
- Drawing systems without showing the quality of each connection. The line type carries the assessment.
- Linking every system to the household circle. Link to the individual member when only one person is involved, such as a child’s school.
- Listing only problems. Strong supports are as important to record as stressors.
- Forgetting arrows. Whether resources flow in or out often explains why a family is depleted.
Who uses this template?
Social workers, child welfare caseworkers, family therapists, community and home health nurses, and BSW/MSW students learning assessment tools.
Common uses
- Intake assessments in social work and community health
- Child and family assessments that require both tools
- Planning supports and referrals
- Discharge planning in hospitals
- Teaching assessment tools in social work programs
What the template covers
- Household genogram in a central circle
- Six labelled outer system circles
- Key with strong, tenuous and stressful lines and arrows
- Notes lines for supports and stressors
- Editable PowerPoint and SVG versions
What is free?
Free and paid, plainly
Frequently asked questions
What is the difference between a genogram and an eco-map?
A genogram maps family members and relationships across generations. An eco-map maps a family’s connections to outside systems such as school, work and services. The combined template shows both: the family inside, the systems around it.
What do the lines on an eco-map mean?
A thick solid line is a strong connection, a dashed line is tenuous, and a hatched line is stressful. Arrows show whether energy and resources flow towards or away from the family.
Who created the eco-map?
Ann Hartman, a social work educator, described the eco-map in 1978 in "Diagrammatic assessment of family relationships", published in Social Casework.
Can I make an eco-map in GenogramAI?
Yes. GenogramAI has a separate eco-map editor, and a genogram can also show institutions linked to individual people. Open the completed example to start from a combined chart.
Further Reading
- Hartman, A. — Diagrammatic assessment of family relationships. Social Casework, 59(8), 465-476, 1978
- McGoldrick, M., Gerson, R., & Petry, S. — Genograms: Assessment and Treatment (4th ed.). W.W. Norton & Company, 2020