Genogram example · Specialty
Genogram with Eco-Map Example: Family and Outside Systems
Quick answer
At a glance
| This example | |
|---|---|
| Family members | 8 |
| Index person | Kate Novak |
| Conditions marked | Medical shading |
| Category | Specialty |
| Tags | Clinical, Educational, Family Structure |
About this genogram
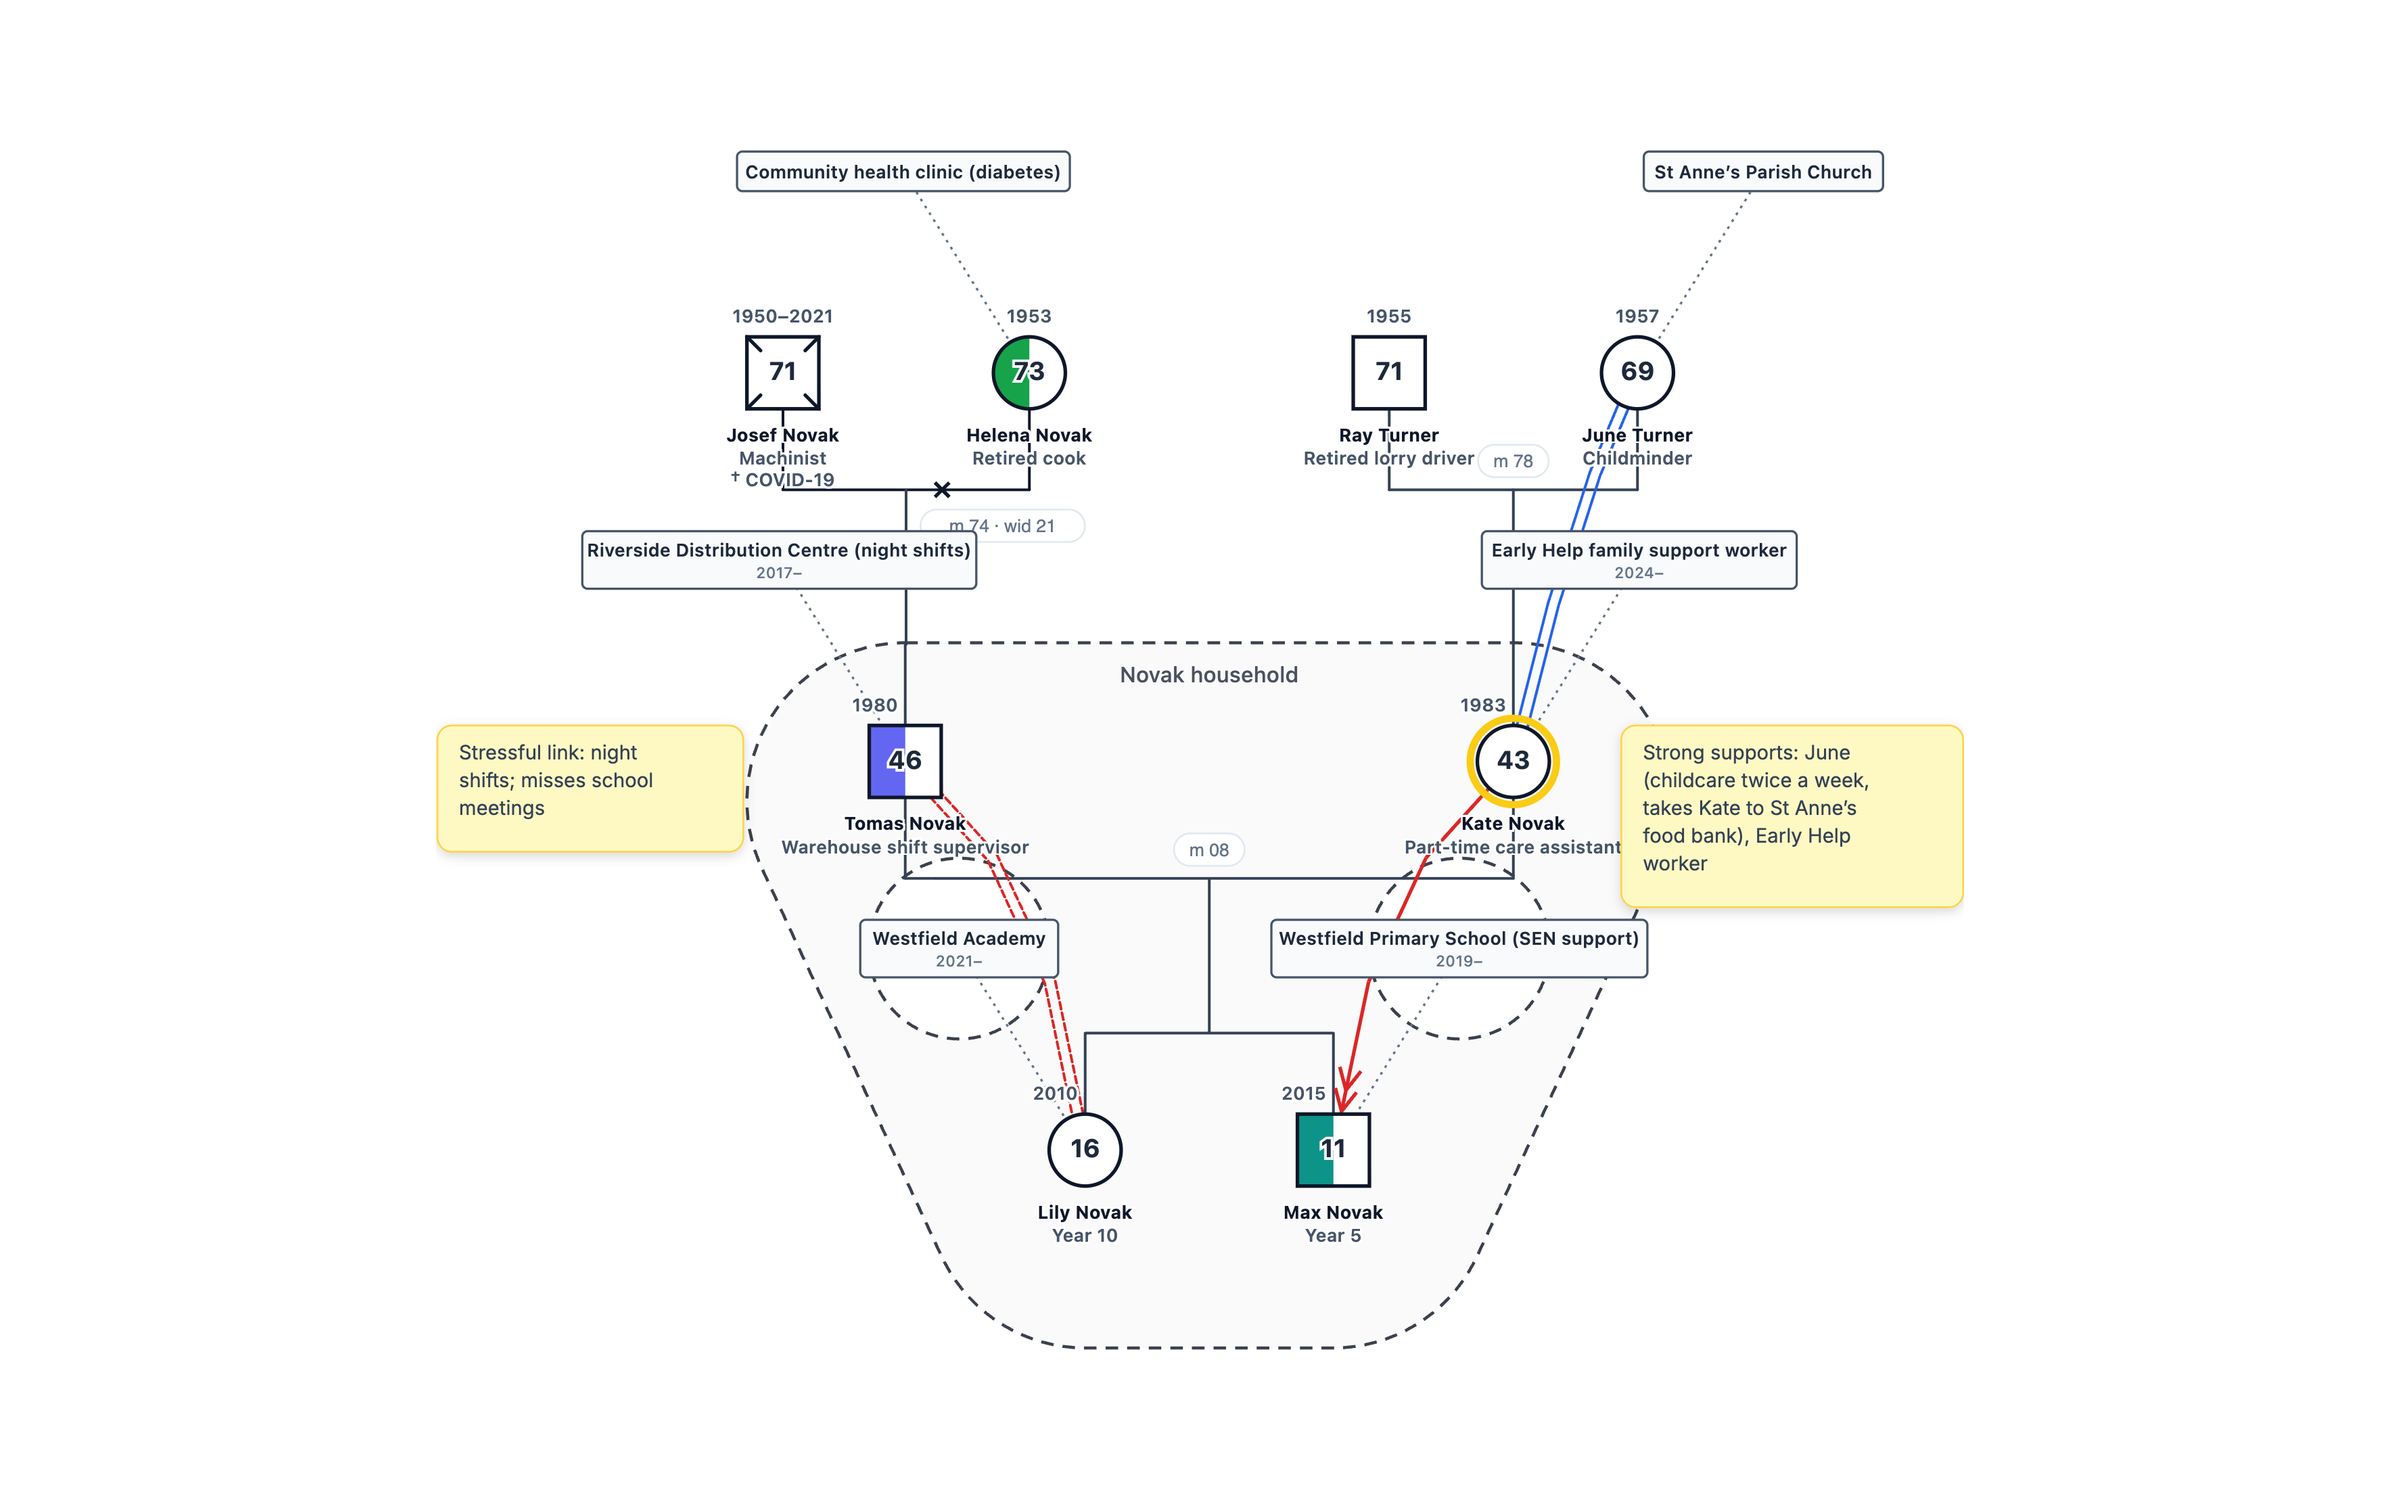
A genogram that also carries the eco-map: the fictional Novak household (two parents and two children) inside a household boundary, with grandparents above and the family's outside systems linked to the people they serve: two schools, a night-shift employer, a parish church, a community health clinic and an Early Help family support worker. Notes record which links support the family and which add stress.
Family analysis
Overview
This chart maps 8 members of the fictional Novak and Turner families plus six outside systems. The index person is Kate Novak (43), a part-time care assistant who feels stretched between work, caring for her son Max, who is autistic, and her husband's night shifts.
The household
The household boundary encloses Tomas (46), Kate, Lily (16) and Max (11). Tomas has depression and works nights at a distribution centre; a note marks that link as stressful because he misses school meetings. Two dashed red lines show conflict between Tomas and Lily.
The outside systems
Each outside system is linked to the person it serves: Westfield Academy to Lily, Westfield Primary School's special educational needs support to Max (since 2019), the employer to Tomas, the Early Help family support worker to Kate (since 2024, after the school raised Lily's attendance), the community health clinic to Helena for her diabetes, and St Anne's Parish Church to June.
Grandparents and extended family
Above the household, Josef Novak died of COVID-19 in 2021 and Helena (73) now lives alone with type 2 diabetes. Kate's parents Ray (71) and June (69) are nearby; two blue lines show Kate is close to June, who provides childcare twice a week and takes Kate to the parish food bank. A caregiving line runs from Kate to Max.
Support and stress
Read together, the genogram and eco-map show where the family's support comes from (June, the church, the Early Help worker and Max's school) and where the pressure sits (Tomas's shifts and depression, his conflict with Lily, and Helena's growing isolation): the starting points for a family support plan.
How do you read the Genogram with Eco-Map Example: Family and Outside Systems?
- 1
Find each person and generation
Squares are males and circles are females, and each row is one generation, oldest at the top. - 2
Follow the family lines
Horizontal lines join partners and vertical lines drop to their children, born left to right in birth order. This genogram uses Marriage, Widowed and Parent-child line lines. - 3
Read the shading
Shaded symbols mark health conditions: Medical shading. Trace each line of descent to see where a condition recurs and where it stops.
Genogram symbols used in this example
| Symbol | Type | What it means |
|---|---|---|
| Male (Square) | Person Symbols | A square represents a male family member. |
| Female (Circle) | Person Symbols | A circle represents a female family member. |
| Index person (highlighted outline) | Person Symbols | The person at the centre of the genogram is drawn with a highlighted outline. |
| Deceased (X) | Person Symbols | An X through the symbol marks a person who has died; birth and death years are written above it. |
| Age inside the symbol | Person Symbols | The current age (or age at death) is written inside each symbol, with years above it. |
| Marriage | Couples | A solid line between partners; the marriage year is written on the line (m 08 = married 2008). |
| Widowed | Couples | A small x on the couple line marks the end of a marriage through death (wid 21). |
| Parent-child line | Couples | A vertical line from the couple line to each child; siblings run oldest to youngest from left to right. |
| Household boundary | Households and systems | A dashed outline around the people who live together, labelled with the household name. |
| Outside system | Households and systems | A labelled box linked by a dotted line to the person it serves, with the year the link began (2019-). |
| Note | Households and systems | A yellow note records which links support the family and which add stress. |
| Close | Relationships | Two parallel blue lines mark an emotionally close relationship. |
| Conflict | Relationships | Two dashed red lines mark an ongoing conflictual relationship. |
| Caregiving | Relationships | A red line with a double arrowhead points from the caregiver to the person she cares for. |
| Medical shading | Medical | The left half of a symbol is shaded for a physical or mental illness and the bottom half for alcohol or drug use; each condition has its own colour, listed in the key. |
Build a genogram like this one
Example prompt
- 1
Start from the dashboard
Sign in to GenogramAI and choose Create with AI (paid plans), or open a blank genogram and use Ask AI (any plan). To start from this exact chart instead, use Open as template. - 2
Describe your family
Paste a description like the one above, with your own names, dates, relationships and health history. - 3
Check and adjust
Edit people and lines by hand, or ask the AI for one change at a time. - 4
Export
Download a PNG on the free plan. PDF and SVG export are on paid plans.
The free plan includes 2 genograms and 5 AI credits a month. See the AI genogram creator for what else it can do.
Related resources
- Download the blank genogram and eco-map template (free PDF and PowerPoint).
- Read how to use eco-maps and genograms together in an assessment.
- For a stand-alone eco-map, use the eco-map template.
- See genograms in social work for assessment practice.
Frequently asked questions
Can a genogram and an eco-map be combined?
Yes. The genogram shows who is in the family and how they are related; the eco-map shows the systems around them. Drawing the outside systems on the genogram, linked to the person each one serves, keeps both on one page. A separate eco-map is still clearer when you need line strength (strong, tenuous, stressful) for every system.
What outside systems should I include?
The ones that affect the family now: schools, employers, health care, faith communities, family support or child services, and the extended family who help. This example has six, and the notes say which give support (June's childcare, the food bank, the Early Help worker) and which add stress (Tomas's night shifts).
Who uses a genogram with eco-map?
Social workers in family support and child welfare, school social workers, health visitors and family therapists, usually at assessment, when the question is both who is in the family and where its help and pressure come from.
Can I use this example as a template?
Yes. Open it in GenogramAI, change the names and years, and attach your own family's services to the people they work with. The Free plan holds 2 genograms and exports PNG; for a stand-alone eco-map, start from the eco-map template.
About this example