Genogram example · Academic & teaching
Family Genogram Example with Explanation
Quick answer
At a glance
| This example | |
|---|---|
| Generations | 3 |
| Family members | 11 |
| Index person | Sophie Martin |
| Emotional relationships | Close and Conflict |
| Conditions marked | Medical shading |
| Category | Academic & teaching |
| Tags | Academic, Educational, Family Structure |
About this genogram
A three-generation family genogram with every person, symbol and line explained in plain words. It includes a divorce and a remarriage, an adopted son, a miscarriage, a death, one close relationship and one conflict, so a student can see how each is drawn and how to describe it in a written assignment. The family is fictional.
Explanation, person by person
Overview
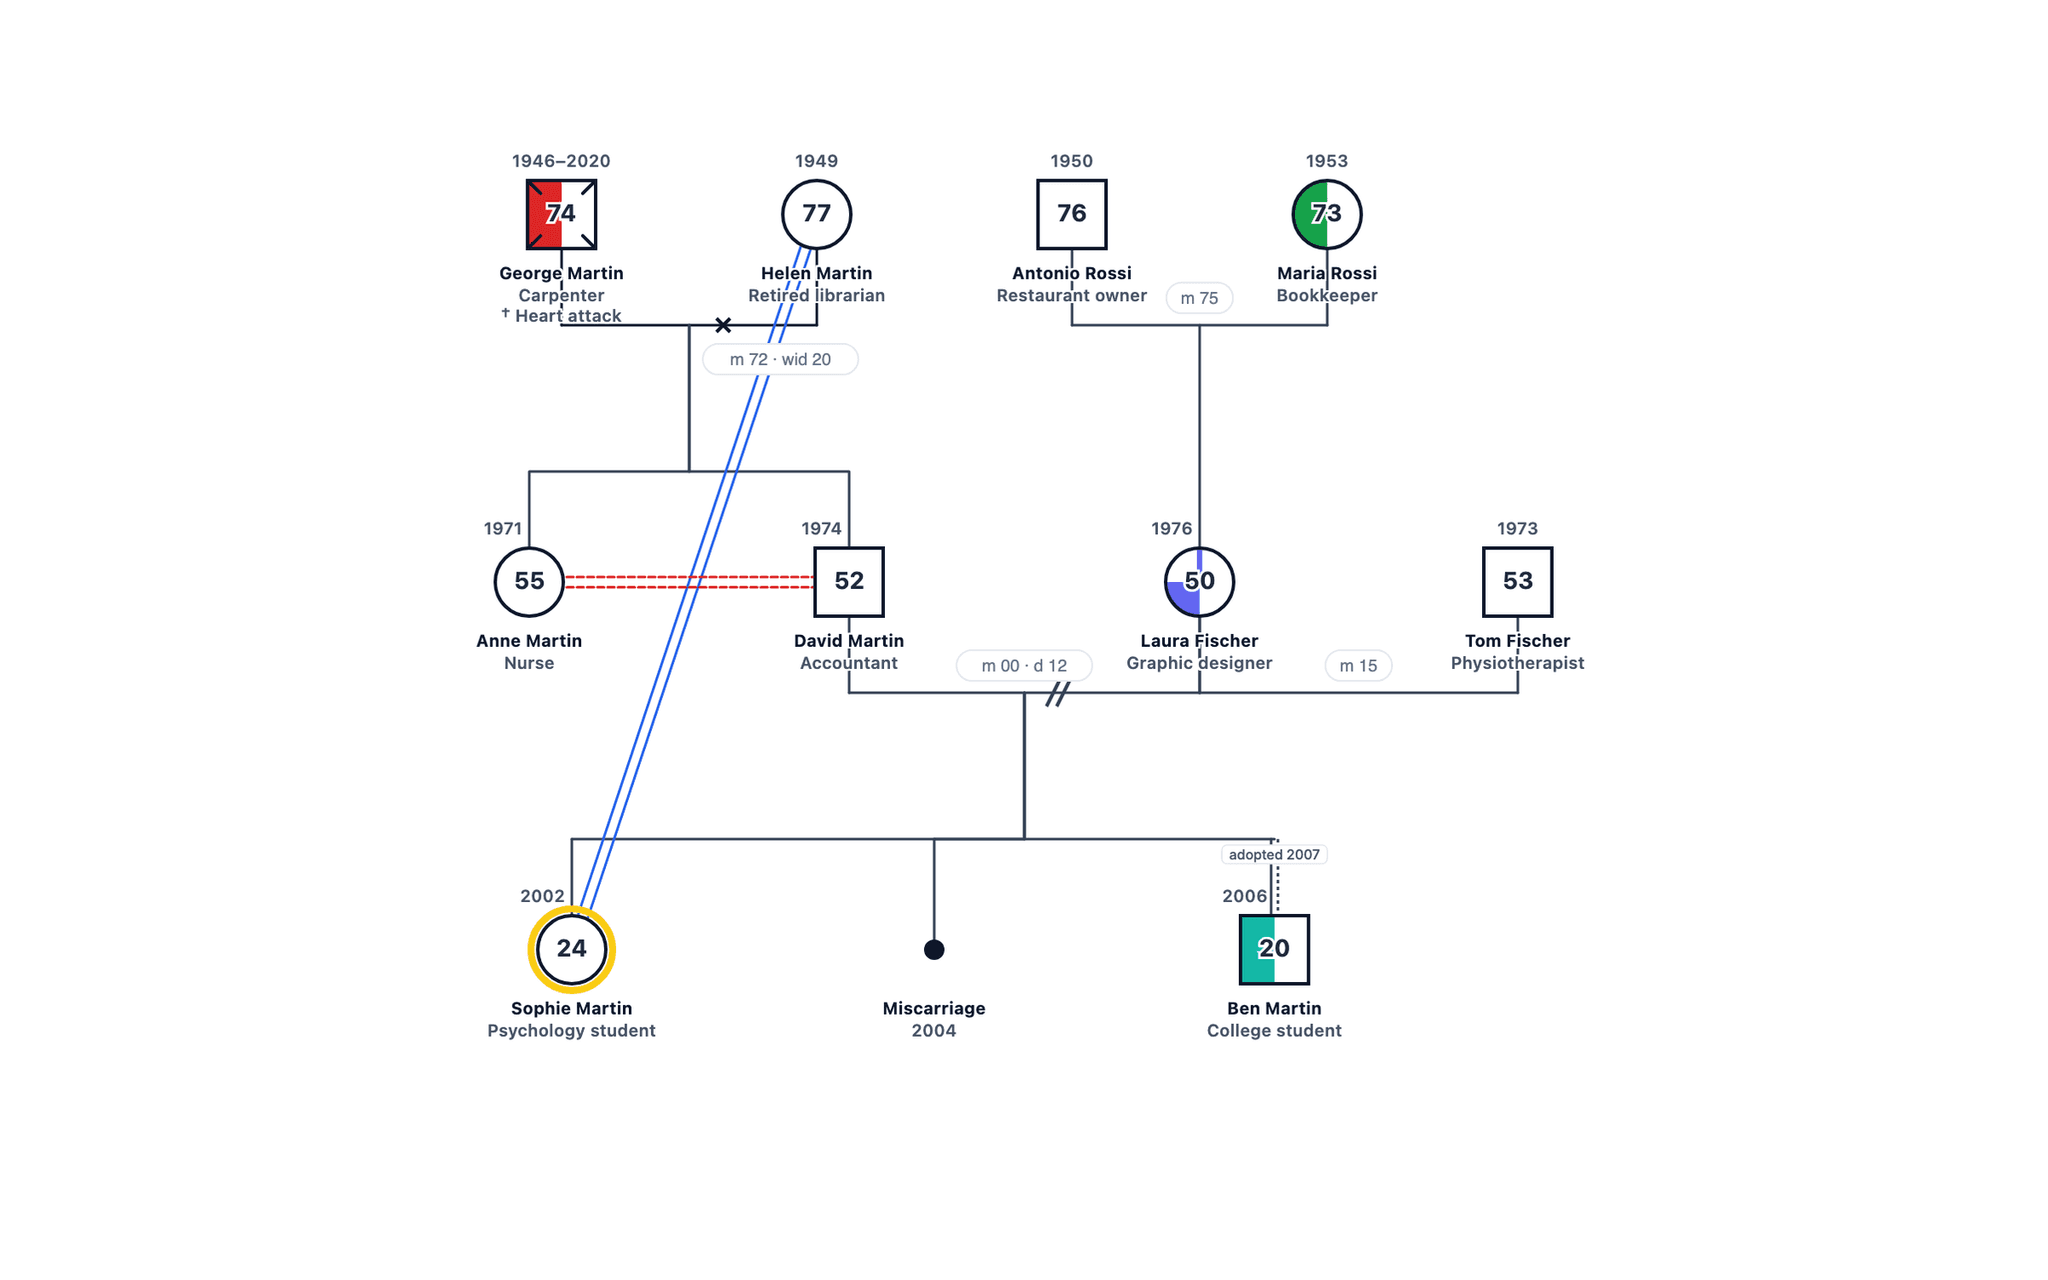
This three-generation genogram maps 11 family members of the fictional Martin and Rossi families. The index person is Sophie Martin (24), a psychology student who drew it for a family systems course; her symbol has the highlighted outline. Read it from the top row (the oldest generation) to the bottom row, and from left to right within each row. Men are squares, women are circles, years are written above each symbol and the current age, or age at death, is inside it.
Generation 1: the grandparents
The top row has Sophie’s two sets of grandparents. On the left, George Martin (square, 1946–2020) and Helen Martin (circle, born 1949) married in 1972; the line between them is labelled "m 72". The X through George’s square shows he has died, 74 is his age at death and "Heart attack" is the cause, so the marriage line also carries a small x and "wid 20" because Helen was widowed in 2020. On the right, Antonio Rossi (born 1950) and Maria Rossi (born 1953) married in 1975 and are both living.
Generation 2: the parents, an aunt and a stepfather
The middle row has George and Helen’s two children, hanging from their parents’ line oldest first: Anne (born 1971), a nurse, and David (born 1974), an accountant. Next to David is Laura (born 1976), the only child of Antonio and Maria, so a single line drops from the Rossi couple to her. David and Laura married in 2000 and divorced in 2012, which is why their line has two slashes and the label "m 00 · d 12". On Laura’s other side is Tom Fischer (born 1973), whom she married in 2015 ("m 15"). Tom is Sophie’s stepfather.
Generation 3: the children
The bottom row has David and Laura’s children, oldest on the left. Sophie was born in 2002. The small black dot is a miscarriage in 2004, kept in birth order because it is part of the family’s history. Ben, born in 2006, has a dotted line labelled "adopted 2007": David and Laura adopted him when he was ten months old. Sophie and Ben lived with their mother after the divorce.
The emotional lines
Two lines show emotional relationships rather than family ties. The double blue line between Sophie and her grandmother Helen means they are close. The red double dashed line between David and his sister Anne means conflict: they fell out over their father’s estate after George died in 2020.
Colours and shading
Coloured halves inside a symbol mark health conditions, and the key beside the chart says which colour is which. George had heart disease, Maria has type 2 diabetes, Laura had depression (partly filled because she is in recovery) and Ben has anxiety. Everyone else has no recorded condition.
What the genogram shows
Read as a whole, the chart shows a family reorganised by divorce and remarriage, a child joining through adoption after a pregnancy loss, and a death that strained the sibling relationship in the middle generation. Those are the patterns a written explanation would go on to discuss. Names and details are fictional.
How do you read the Family Genogram Example with Explanation?
- 1
Find each person and generation
Squares are males and circles are females, and each row is one generation, oldest at the top. It spans 3 generations. - 2
Follow the family lines
Horizontal lines join partners and vertical lines drop to their children, born left to right in birth order. This genogram uses Marriage, Divorce, Widowed, Parent-child line and Adopted child lines. - 3
Read the emotional lines
Lines drawn between two people show how they relate: Close and Conflict. Notice who has several lines converging on them, and which patterns repeat from one generation to the next. - 4
Read the shading
Shaded symbols mark health conditions: Medical shading. Trace each line of descent to see where a condition recurs and where it stops.
Genogram symbols used in this example
| Symbol | Type | What it means |
|---|---|---|
| Male (Square) | People | Each man is a square: George, Antonio, David, Tom and Ben. |
| Female (Circle) | People | Each woman is a circle: Helen, Maria, Anne, Laura and Sophie. |
| Index person (highlighted outline) | People | Sophie, who drew the genogram, has the highlighted outline. |
| Deceased (X) | People | The X through George’s square shows he died in 2020; 74 inside is his age at death. |
| Miscarriage | People | The small black dot between Sophie and Ben is a miscarriage in 2004. |
| Marriage | Couples | A solid line joins a married couple, with the year: George and Helen (m 72), Antonio and Maria (m 75), Laura and Tom (m 15). |
| Divorce | Couples | Two slashes across David and Laura’s line show their divorce: married 2000, divorced 2012. |
| Widowed | Couples | The small x on George and Helen’s line and "wid 20" show the marriage ended with George’s death. |
| Parent-child line | Children | Vertical lines drop from a couple line to each child, oldest on the left. |
| Adopted child | Children | Ben’s dotted line and the label "adopted 2007" show he was adopted. |
| Close | Emotional Relationships | The double blue line between Sophie and her grandmother Helen means a close relationship. |
| Conflict | Emotional Relationships | The red double dashed line between David and his sister Anne means conflict. |
| Medical shading | Medical | A coloured section of a symbol marks a condition, listed in the key: heart disease (George), type 2 diabetes (Maria), depression in recovery (Laura) and anxiety (Ben). |
Build a genogram like this one
Example prompt
- 1
Start from the dashboard
Sign in to GenogramAI and choose Create with AI (paid plans), or open a blank genogram and use Ask AI (any plan). To start from this exact chart instead, use Open as template. - 2
Describe your family
Paste a description like the one above, with your own names, dates, relationships and health history. - 3
Check and adjust
Edit people and lines by hand, or ask the AI for one change at a time. - 4
Export
Download a PNG on the free plan. PDF and SVG export are on paid plans.
The free plan includes 2 genograms and 5 AI credits a month. See the AI genogram creator for what else it can do.
Related resources
- Writing this up for a course? See our genogram assignment guide.
- Read more about the three-generation genogram.
- Start smaller with a simple genogram example.
- Every symbol is in the genogram symbols guide.
Frequently asked questions
How do I explain a genogram in an assignment?
Work from the top down and from left to right. Introduce the oldest generation, then each couple and their children, then the youngest generation, saying who each person is and what their symbol shows. Then explain the relationship lines and finish with the patterns you notice. The walkthrough on this page follows that order.
What does the X through George’s square mean?
An X through a symbol means the person has died. George was born in 1946 and died in 2020, so "1946–2020" is written above the square and his age at death, 74, is inside it. "Heart attack" under his name is the cause of death.
Why is Ben’s line dotted, and what does "adopted 2007" mean?
A dotted child line means the child was adopted rather than born to the couple. Ben was born in 2006 and adopted by David and Laura in 2007, which the label records.
What is the small black dot under David and Laura?
It marks a miscarriage, Laura’s pregnancy that ended in 2004. Pregnancy losses are drawn in birth order on the parents’ line, between Sophie (2002) and Ben (2006).
What is the difference between the two slashes and the plain line?
Two slashes across a couple line mean a divorce: David and Laura married in 2000 and divorced in 2012 ("m 00 · d 12"). The plain line between Laura and Tom is her current marriage, from 2015.
Can I build a genogram like the Family Genogram Example with Explanation example?
Yes. Open GenogramAI, choose Create with AI on the dashboard (paid plans) or open a blank genogram and use Ask AI in the editor (any plan), and describe the family in plain words: who is in it, how they are related, key dates and the relationships or health conditions you want to show. The AI draws the symbols and lines, and you can then edit by hand or ask for one change at a time. A family of 11 people like this one takes a short paragraph to describe. The free plan includes 2 genograms and 5 AI credits a month, with PNG export.
About this example