Genogram example · Medical & hereditary
Nursing Genogram Example: Family Health Assessment
Quick answer
At a glance
| This example | |
|---|---|
| Generations | 3 |
| Family members | 10 |
| Index person | Patricia Bennett |
| Conditions marked | Medical shading, Suspected condition and In remission or recovery |
| Category | Medical & hereditary |
| Tags | Medical, Educational, Clinical |
About this genogram
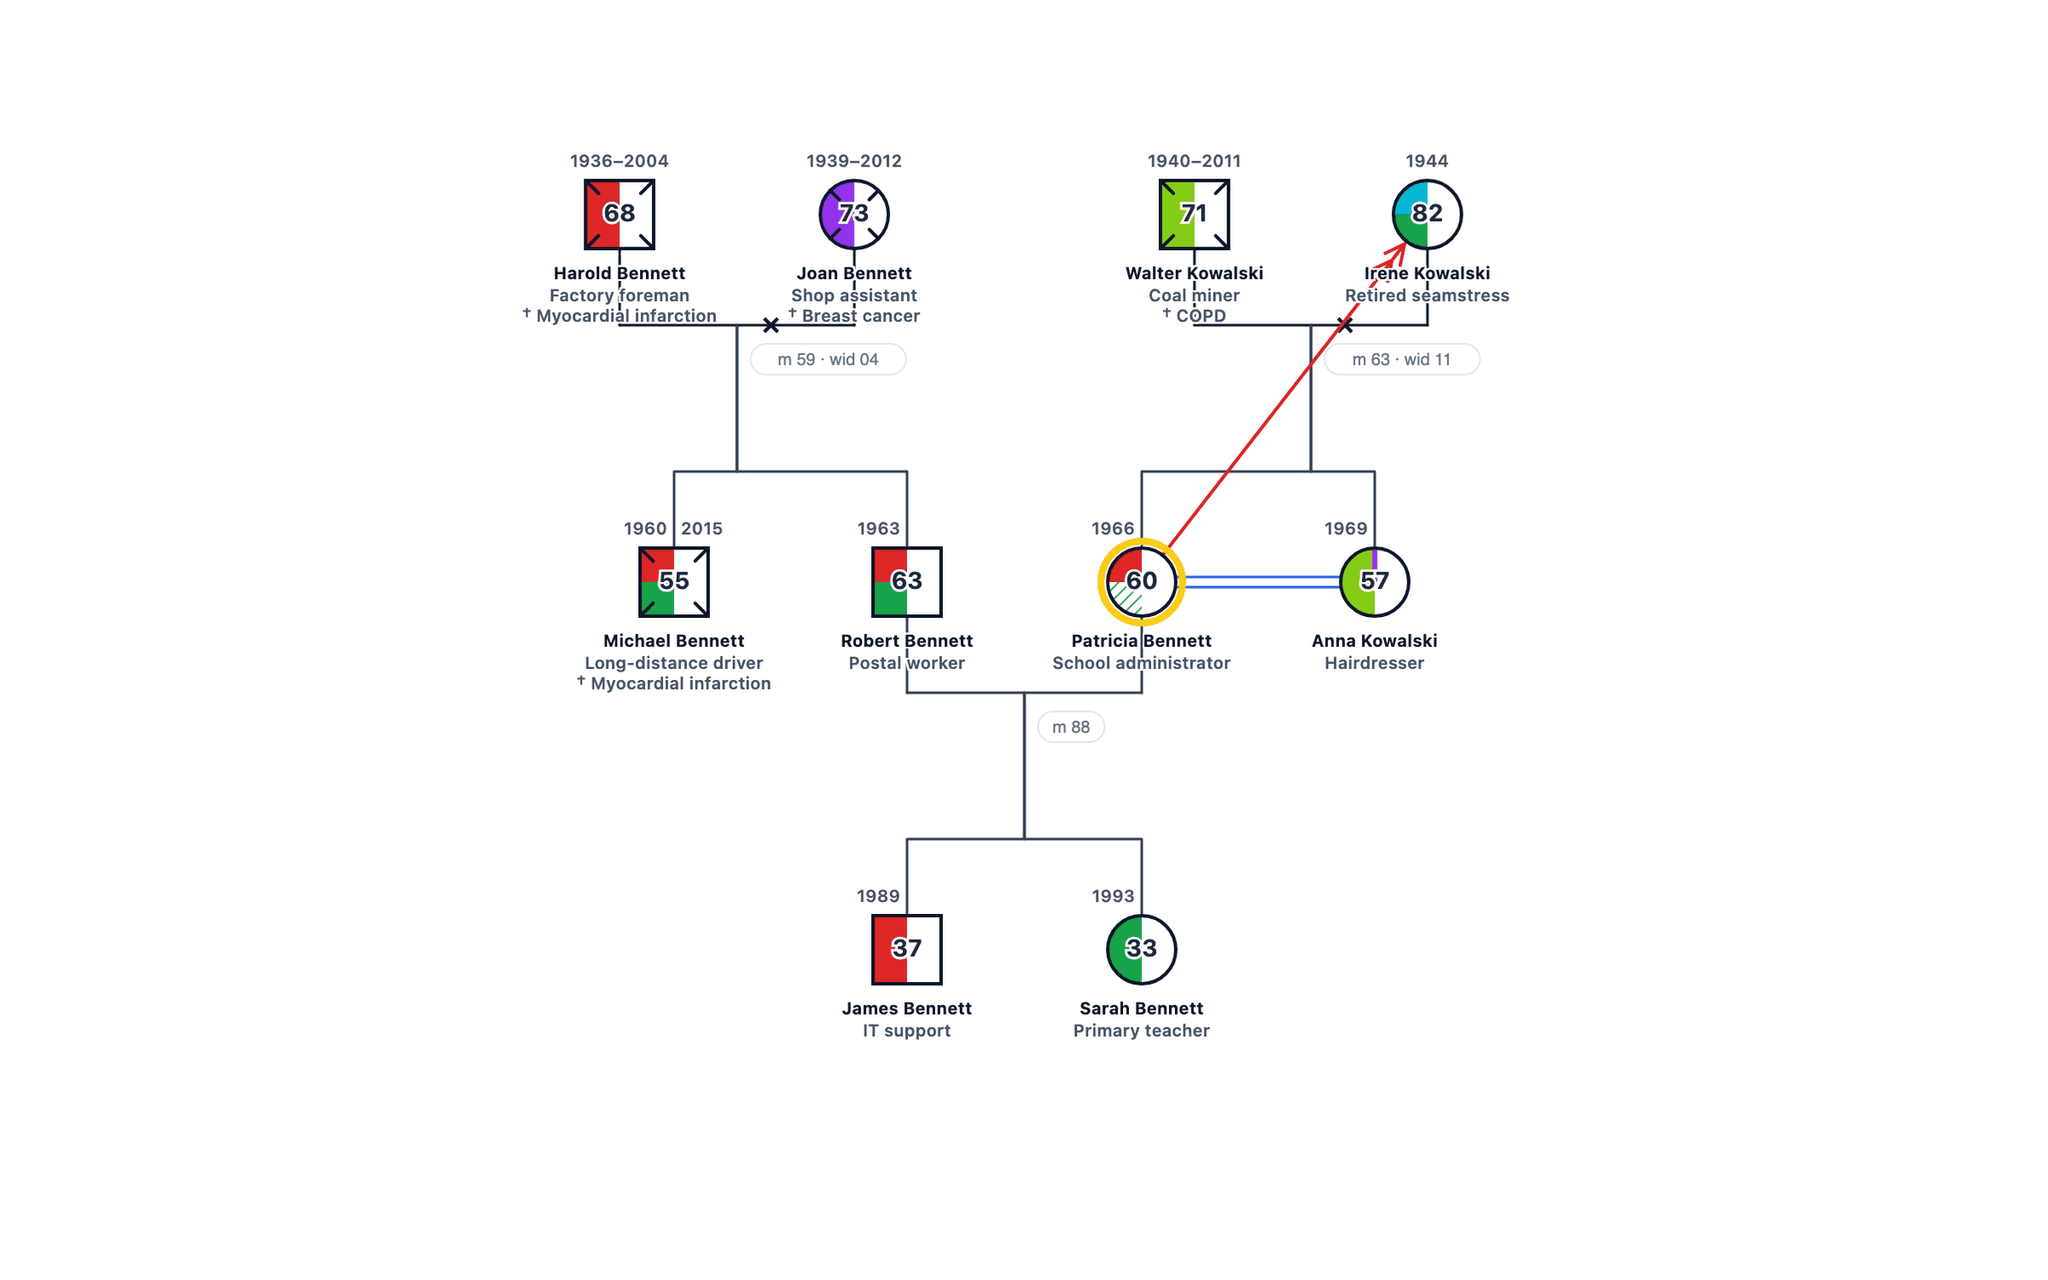
A nursing genogram for a family health assessment across three generations. Type 2 diabetes, hypertension, myocardial infarction, breast cancer and smoking-related COPD are shaded on each person, with causes and ages of death, and a caregiving line shows an adult daughter caring for her mother with dementia. The family is fictional.
Medical analysis
Overview
This three-generation genogram maps 10 family members for a fictional family health assessment. The index person is Patricia Bennett (60), a school administrator who came to a health check with raised blood pressure and a borderline HbA1c, and who has cared for her mother since 2023. The chart is laid out the way community and student nurses are asked to present a family health history.
Cardiovascular and metabolic risk
Heart disease and diabetes run through the paternal side. Patricia’s father-in-law Harold had hypertension and died of a myocardial infarction at 68, and his son Michael died of a myocardial infarction at 55 after years of type 2 diabetes. Patricia’s husband Robert has hypertension and type 2 diabetes, and their son James already has raised cholesterol. On Patricia’s own side, her mother Irene has type 2 diabetes, and her daughter Sarah had gestational diabetes in 2023, a known marker of later type 2 diabetes.
Cancer and lung disease
Two women have had breast cancer: Joan, who died of it at 73, and Patricia’s sister Anna, treated at 52 and now in remission. Anna was offered BRCA testing in 2021, and the result matters for Patricia and Sarah. Walter, Patricia’s father, worked as a coal miner, smoked heavily and died of COPD at 71; Anna has asthma.
Caregiving
Irene, now 82, has Alzheimer’s dementia. The caregiving line from Patricia to Irene and the close line between Patricia and Anna show who carries the care and who supports her. Caregiver strain is part of the presenting concern, alongside Patricia’s own rising blood pressure and suspected prediabetes, drawn with hatching.
Nursing priorities
From a nursing perspective the genogram points to cardiovascular screening for Robert and James, diabetes prevention for Patricia and Sarah, a referral to discuss breast cancer genetics, carer support for Patricia and a care plan for Irene. Names and details are fictional.
How do you read the Nursing Genogram Example: Family Health Assessment?
- 1
Find each person and generation
Squares are males and circles are females, and each row is one generation, oldest at the top. It spans 3 generations. - 2
Follow the family lines
Horizontal lines join partners and vertical lines drop to their children, born left to right in birth order. This genogram uses Marriage, Widowed and Parent-child line lines. - 3
Read the shading
Shaded symbols mark health conditions: Medical shading, Suspected condition and In remission or recovery. Trace each line of descent to see where a condition recurs and where it stops.
Genogram symbols used in this example
| Symbol | Type | What it means |
|---|---|---|
| Male (Square) | Person Symbols | A square represents a male family member. |
| Female (Circle) | Person Symbols | A circle represents a female family member. |
| Index person (highlighted outline) | Person Symbols | The person at the centre of the assessment is drawn with a highlighted outline. |
| Deceased (X) | Person Symbols | An X through the symbol marks a person who has died; birth and death years are written above it. |
| Age inside the symbol | Person Symbols | The current age (or age at death) is written inside each symbol, with years above it. |
| Marriage | Couples | A solid line between partners; the marriage year is written on the line (m 90 = married 1990). |
| Widowed | Couples | A small x on the couple line marks the end of a marriage through death (wid 15). |
| Parent-child line | Couples | A vertical line from the couple line to each child; siblings run oldest to youngest from left to right. |
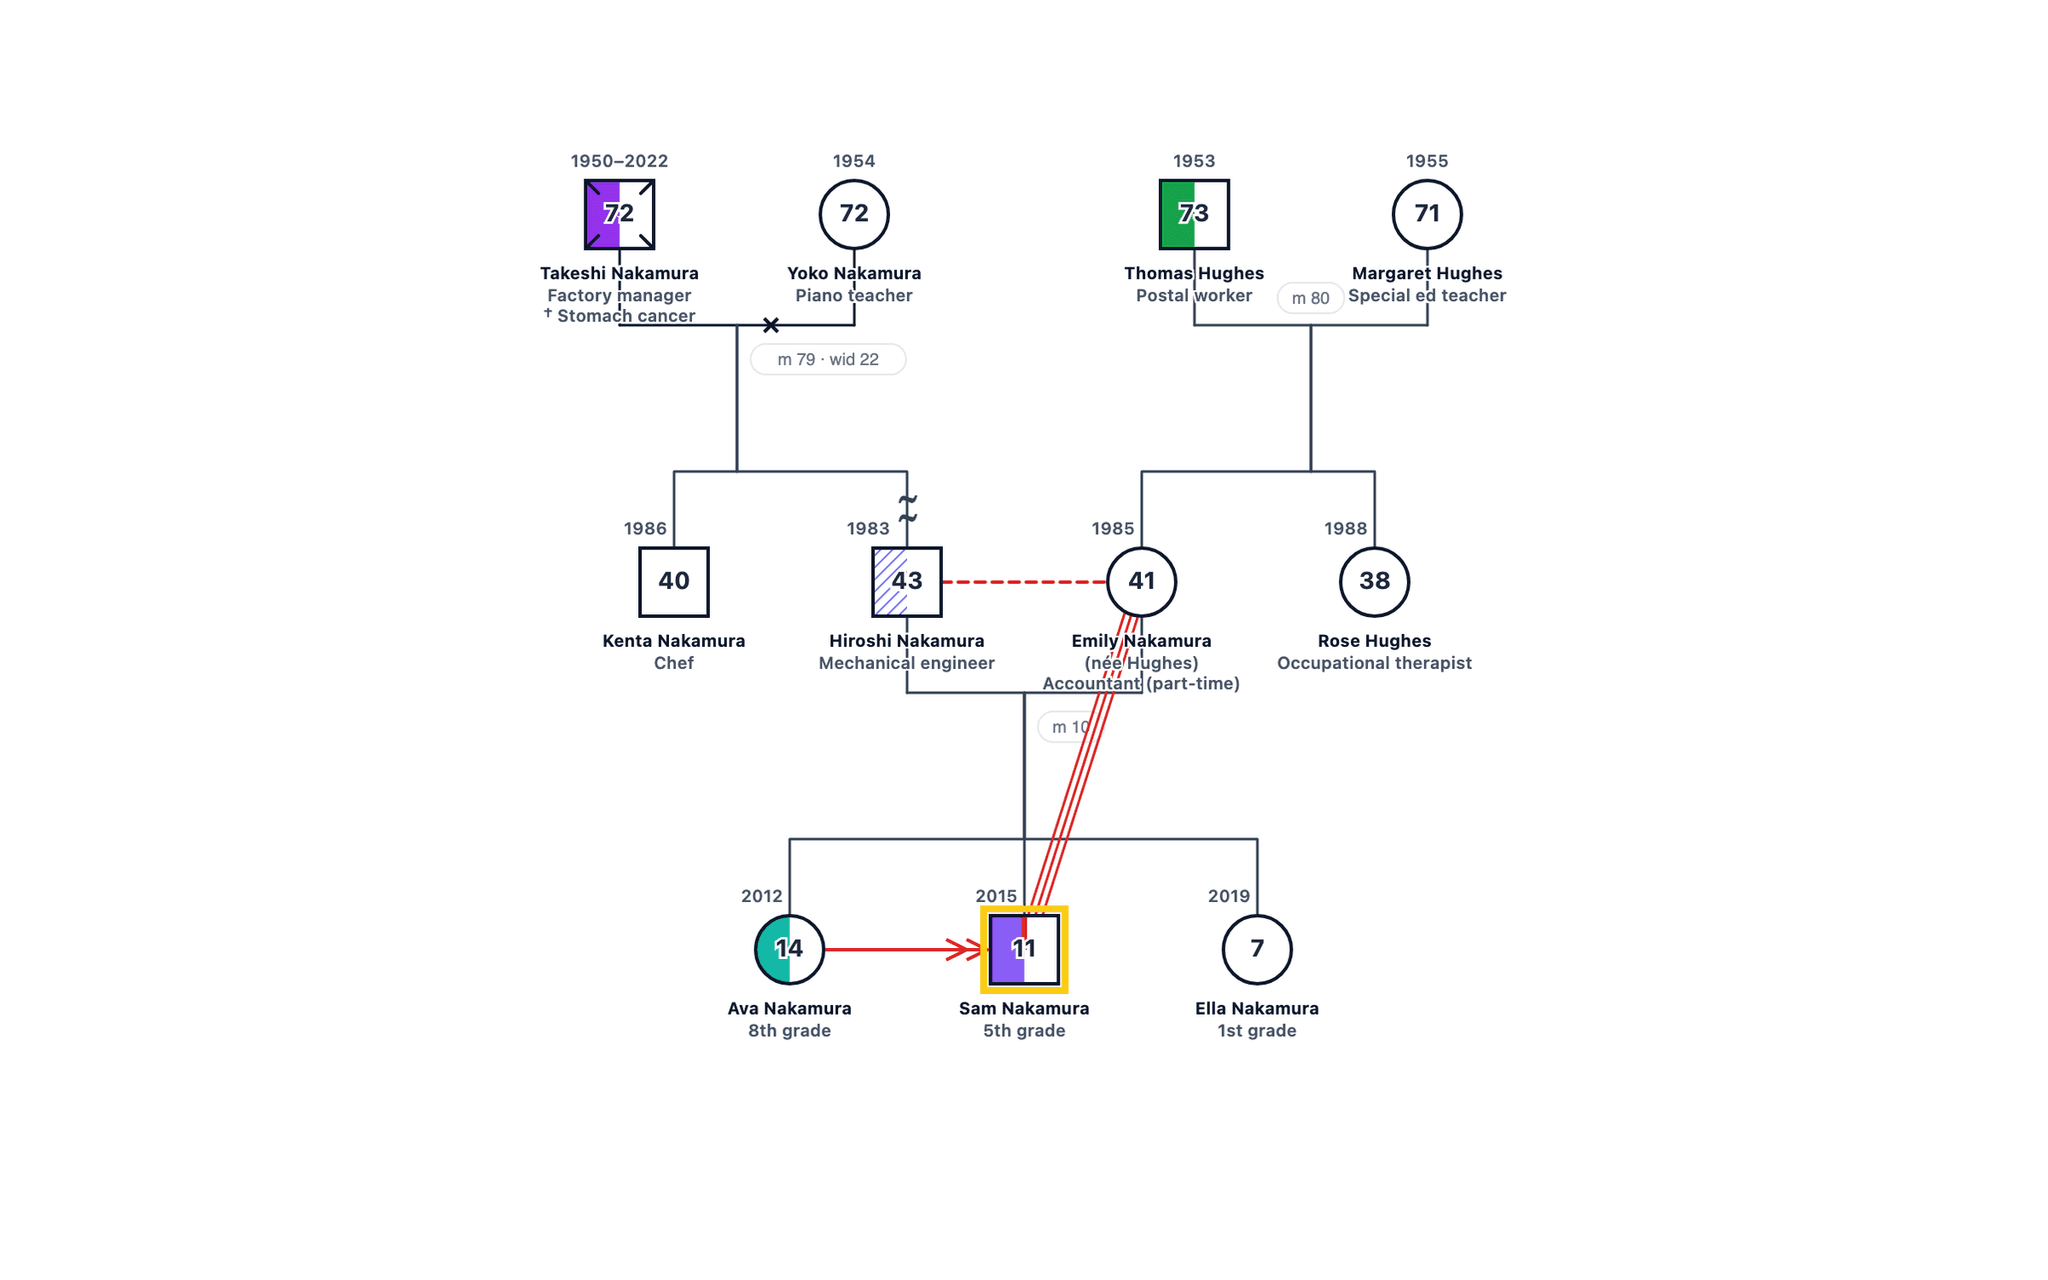
| Caregiving | Relationships | A red line with a double arrowhead points from the caregiver to the person she cares for. |
| Close | Relationships | Two parallel blue lines mark an emotionally close relationship. |
| Medical shading | Medical | The left half of a symbol is shaded for a physical or mental illness and the bottom half for alcohol or drug use; each condition has its own colour, listed in the key. Hatching means suspected, a partial fill means in recovery. |
| Suspected condition | Medical | Hatching instead of a solid fill marks a condition that is suspected or being investigated. |
| In remission or recovery | Medical | A partly filled section marks a condition in remission or recovery. |
Build a genogram like this one
Example prompt
- 1
Start from the dashboard
Sign in to GenogramAI and choose Create with AI (paid plans), or open a blank genogram and use Ask AI (any plan). To start from this exact chart instead, use Open as template. - 2
Describe your family
Paste a description like the one above, with your own names, dates, relationships and health history. - 3
Check and adjust
Edit people and lines by hand, or ask the AI for one change at a time. - 4
Export
Download a PNG on the free plan. PDF and SVG export are on paid plans.
The free plan includes 2 genograms and 5 AI credits a month. See the AI genogram creator for what else it can do.
Related resources
- Read about genograms and eco-maps in nursing.
- Assignment tips are in genograms for nursing students.
- See the guide to the medical genogram and its symbols.
- See the caregiving line in the symbols guide.
Frequently asked questions
What should a nursing genogram include?
At least three generations; ages, or ages and causes of death; chronic and hereditary conditions marked on each person; and the relationships that matter for care, such as who looks after whom. This example adds a presenting concern for the index person and a short timeline.
How are causes and ages of death shown?
The person’s symbol has an X, the birth and death years are written above it, the age at death is inside the symbol and the cause is written below the name. Harold Bennett died of a myocardial infarction at 68, Joan of breast cancer at 73, Walter of COPD at 71 and Michael of a myocardial infarction at 55.
How do you show a caregiver on a genogram?
A caregiving line, a red line with a double arrowhead, points from the carer to the person cared for. Here it runs from Patricia to her mother Irene, who has Alzheimer’s dementia.
What risks does this family health assessment point to?
Early heart disease in the paternal line (two men with myocardial infarctions, one at 55), type 2 diabetes on both sides, breast cancer in two women, which is a reason to discuss genetic counselling, and the effect of caregiving on Patricia’s own health. Smoking links Walter’s COPD to advice for the next generation.
Can I build a genogram like the Nursing Genogram Example: Family Health Assessment example?
Yes. Open GenogramAI, choose Create with AI on the dashboard (paid plans) or open a blank genogram and use Ask AI in the editor (any plan), and describe the family in plain words: who is in it, how they are related, key dates and the relationships or health conditions you want to show. The AI draws the symbols and lines, and you can then edit by hand or ask for one change at a time. A family of 10 people like this one takes a short paragraph to describe. The free plan includes 2 genograms and 5 AI credits a month, with PNG export.
About this example